Most web developers should know it by now but the Chrome web browser embeds an amazing set of development tools. The Chrome DevTools are organized thanks to a collection of tabs used to group relevant tools in categories. In this post, we will start reviewing some of those tools.
General
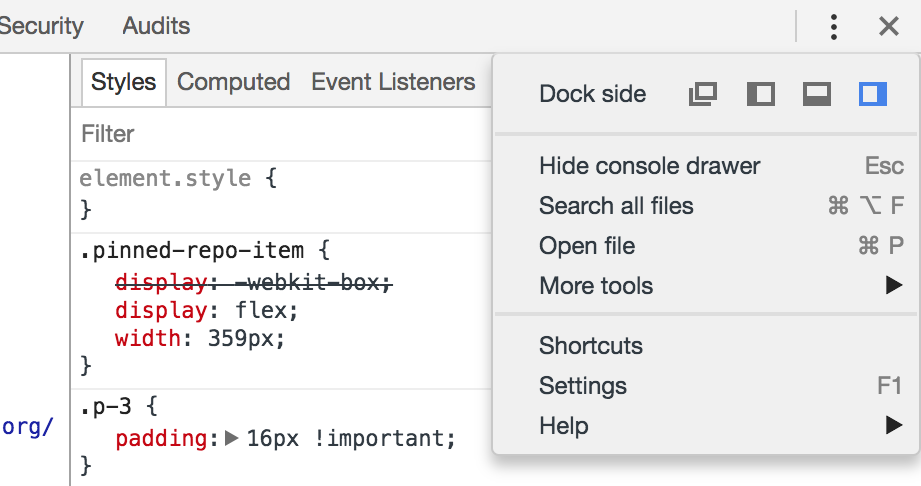
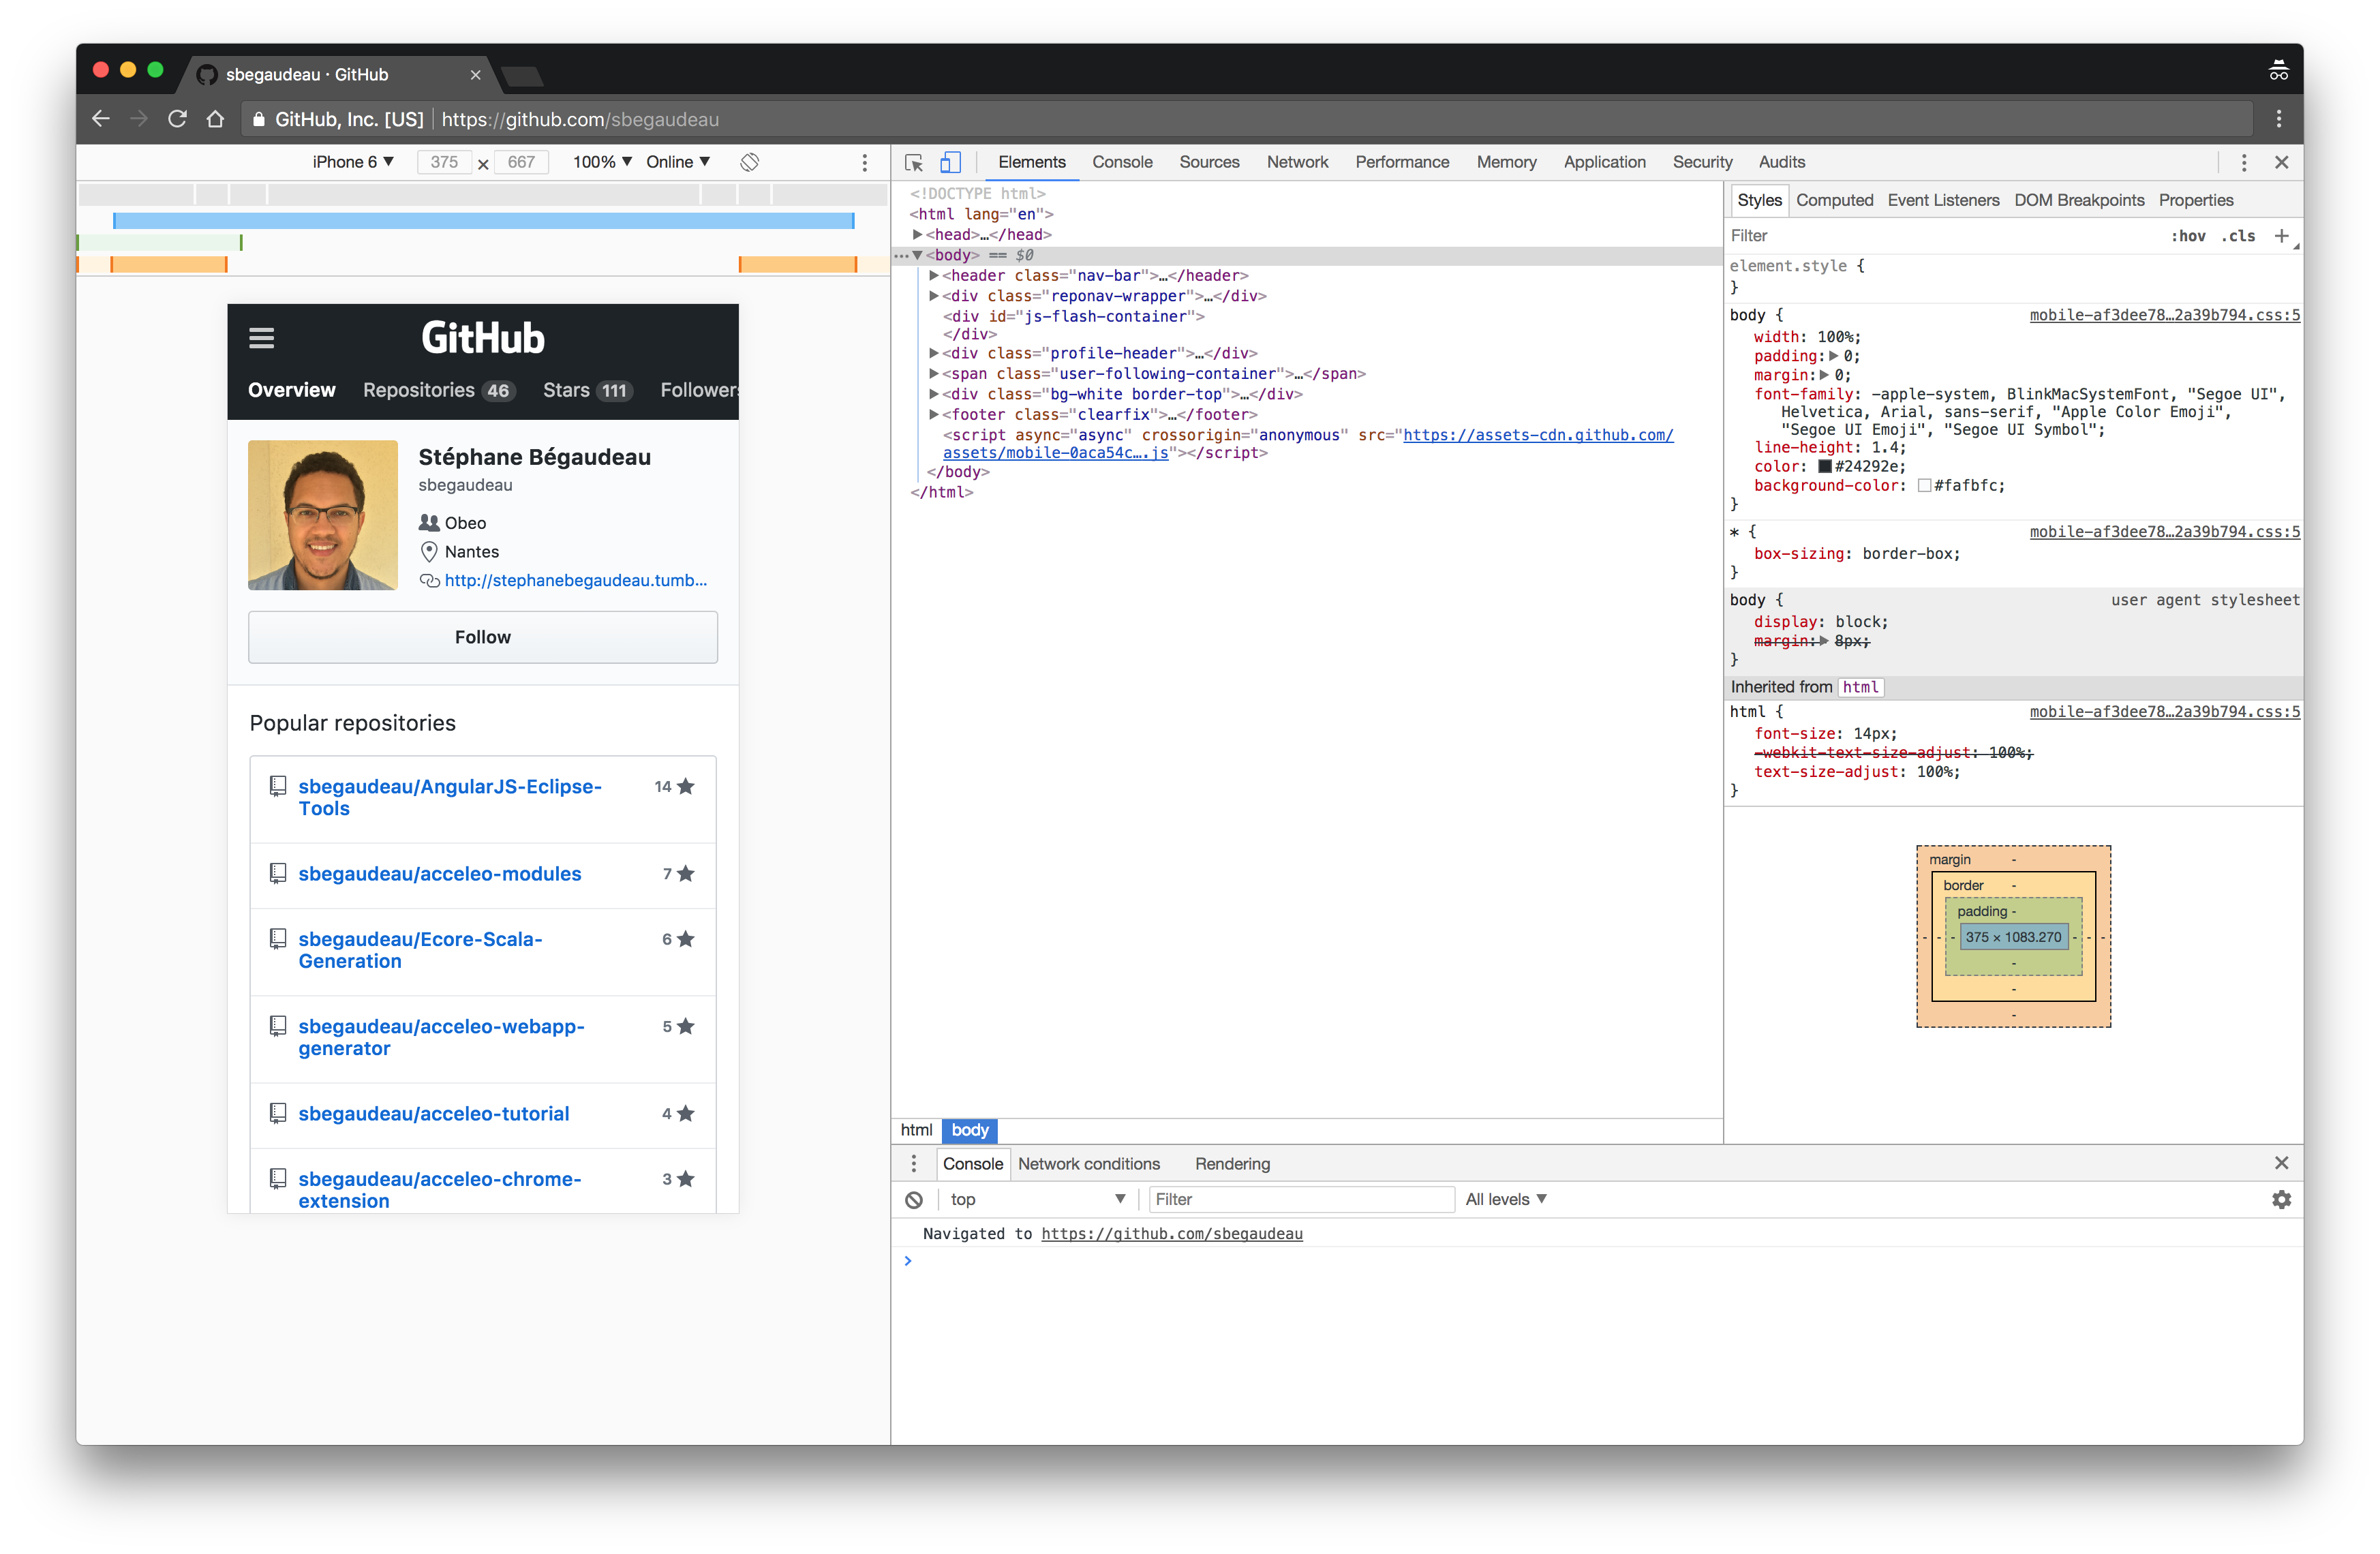
You can open the Chrome Devtools by using the contextual menu on any element of the current web page and selecting Inspect or by using the shortcut ⌥ + ⌘ + i (Mac) or Ctrl + Shift + i (Win/Linux). Once opened, customize where the Devtools will be displayed thanks to the Customize and control Devtools button which allows you to select if you want the Devtools on the left, right, bottom or even in another window. This button allows you to open additional tools in drawers at the bottom of the Devtools (more about that later).
Elements
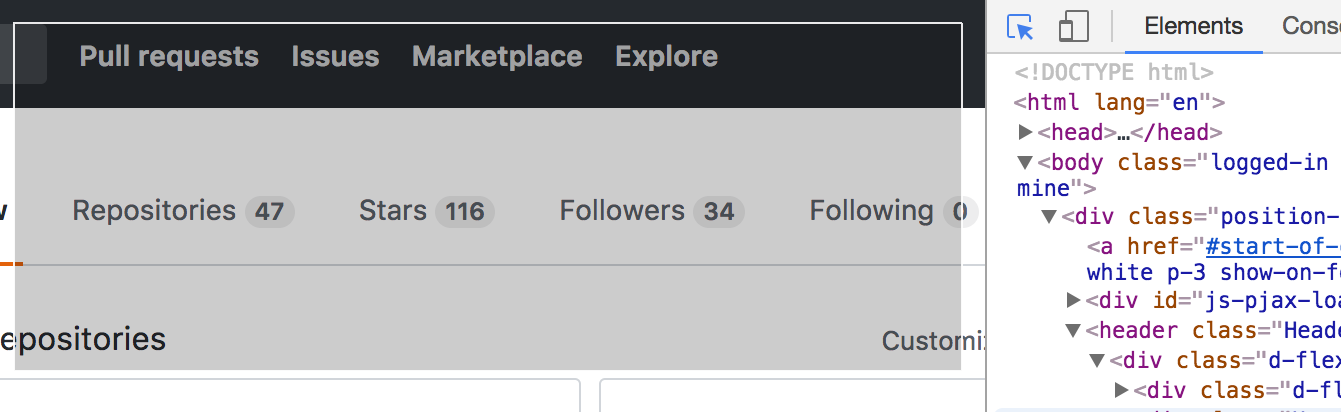
The Elements tab is the first tab displayed in the Chrome Devtools. It is used to inspect and manipulate the Document Object Model (DOM) of the current page. It contains two major parts, on the left a tree-based view of all the elements of the DOM and on the right, you have various tabs showing some properties for the currently selected element.
You can navigate the DOM with the tree-based view and it will highlight the currently selected element on the current page. By double-clicking on an element, its content or its attribute can be edited very easily. A contextual menu gives you the ability to edit, copy, hide or even delete an element. It is also possible to add some breakpoints on the DOM element which can be triggered when some of its attributes will be modified or even when it will be removed.
Styles
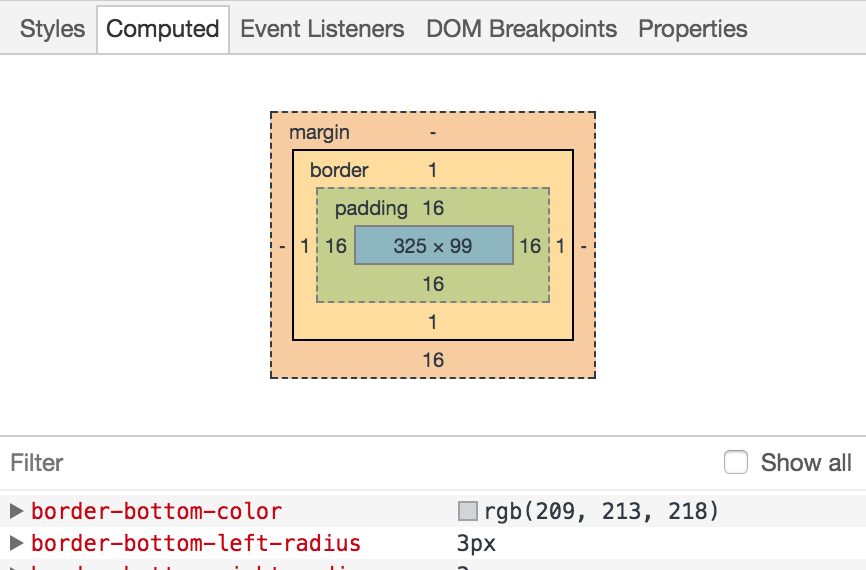
On the right, in the tab Styles, the Devtools will display the CSS properties of the selected element. This Styles tab will show all the CSS selectors that are used to compute the style of the element. At the bottom of the Styles tab, the Box model is visible, it shows the size of the element, its padding, border, and margin.
To edit the properties of the Box model, double-click on it and enter a new value for the margin, border or even padding of the element. The colors used in this illustration of the Box model are also reused on the selected element.
State & classes
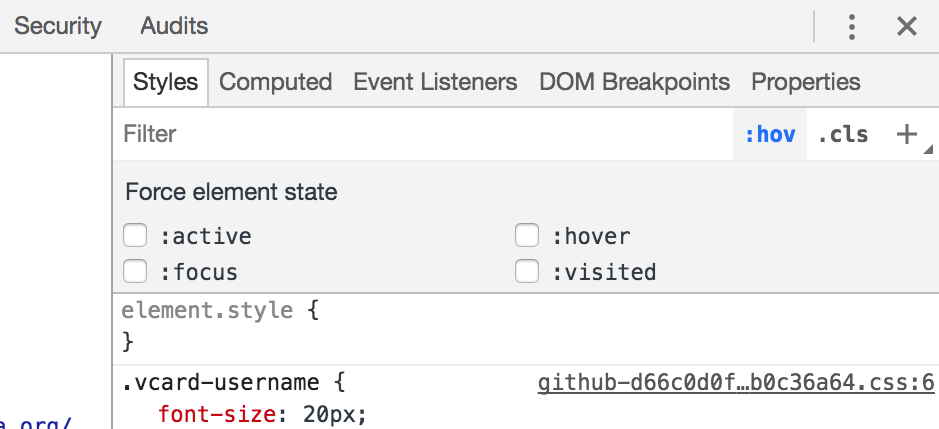
In order to debug some complex state, the Chrome Devtools gives you the ability to change the state of the element to :active, :hover, :focus or even :visited with the :hov button in order to test for example your CSS when the end user will have its cursor on top of a button. A search field is also available to filter all the CSS rules and selectors applied to the element. You can also add new CSS rules for the element.
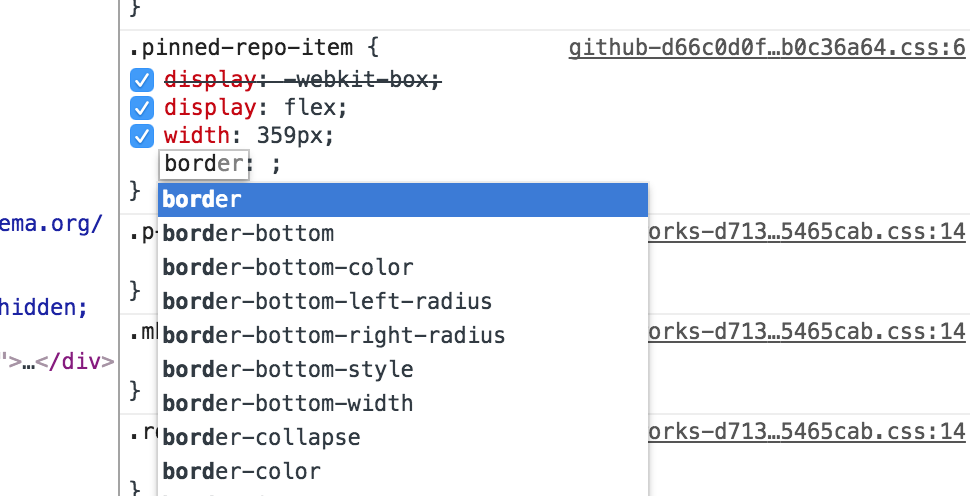
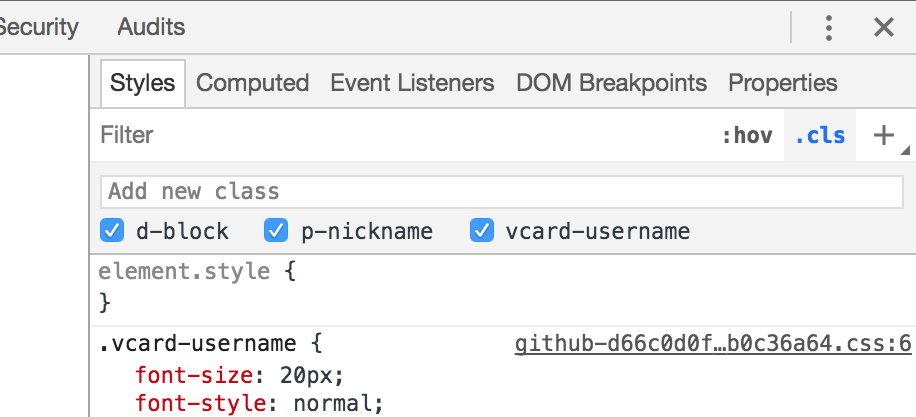
In the Styles tab, check/uncheck any CSS rule to see its impact on the page. Use the .cls button to easily modify the CSS classes that are used by the selected element.
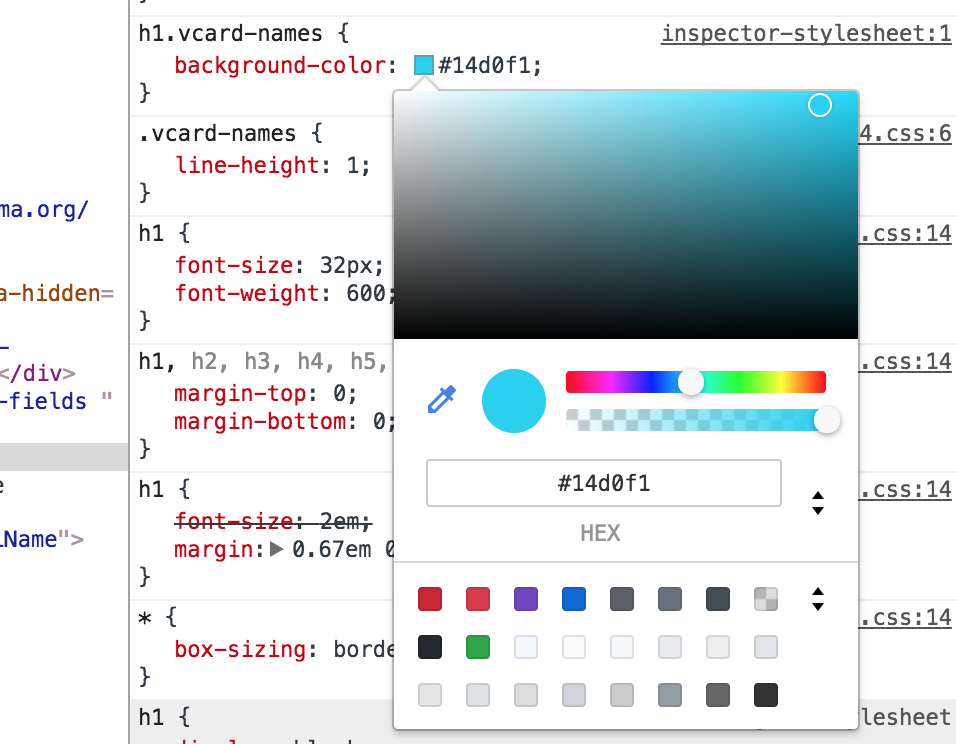
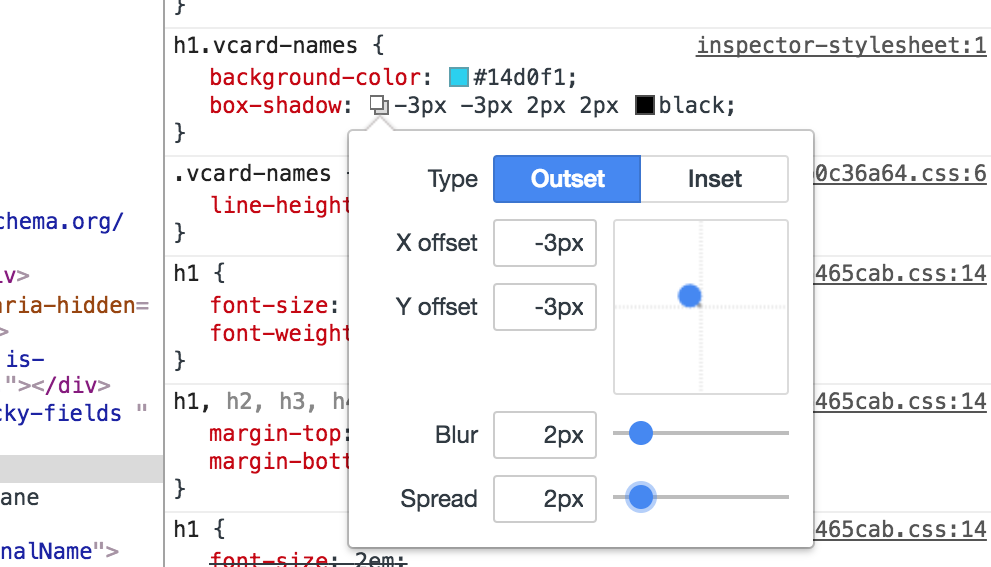
Click inside of a CSS rule to add new properties. Some shortcuts are available if you just want to add some color or shadow to the current element. The Chrome Devtools gives you access to completion and validation in order to add new CCS properties and custom editors are available to some complex ones like colors or shadows. The DOM will be updated in real time if you change any CSS properties.
You also have the ability to capture a screenshot of the page by clicking on the inspect icon on the top left corner of the element tab and then by holding ⌘ (Mac) or Control (Win/Linux) and selecting an area of the page.
Additional tabs
The end result computed from all the CSS rules that apply to the element can be seen in the Computed tab. It is also possible to visualize the various events listeners registered on the element and its ancestors in the Event Listeners tab. You can see the DOM breakpoints of the elements and all its JavaScript properties from the dedicated tabs DOM Breakpoints and Properties. The changes made in the Elements tab are not saved forever so don’t forget to refresh the page to get back to a clean state.
Layout
Test your page on various devices using the button on the left of the Elements tab in order to activate the Device toolbar where you can simulate your website on various resolutions. The Device toolbar gives you the ability to simulate the device orientation and to see all your CSS media queries breakpoints. The list of devices can be customized, allowing you to specify the resolution of any device. A low-quality internet connection or even the lack of internet connectivity can be simulated to test the behavior of your site offline for example.
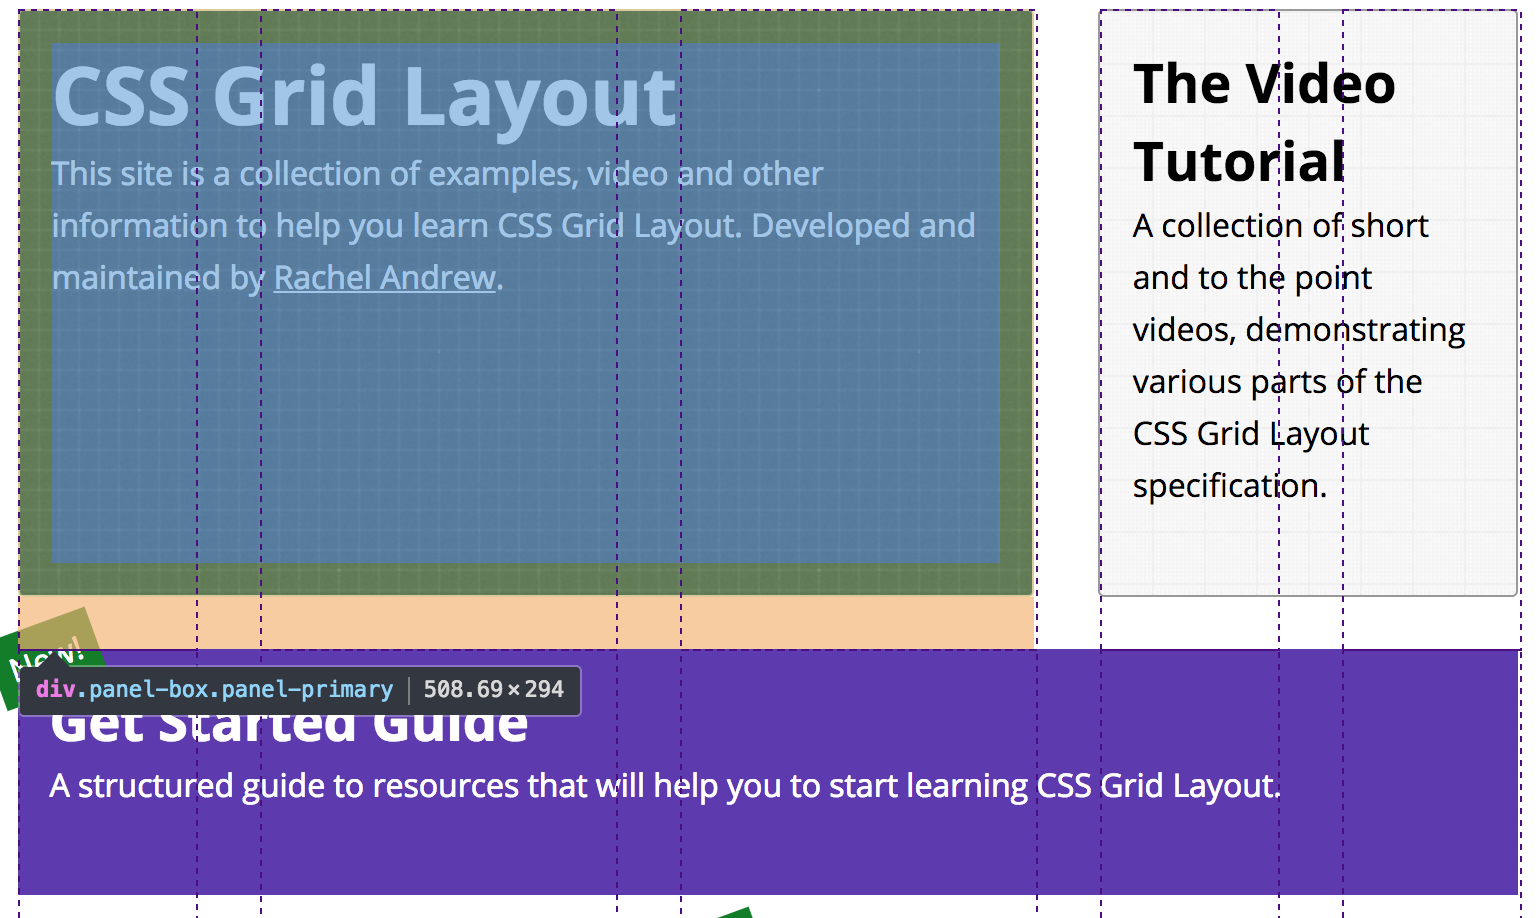
Chrome Devtools has also shipped some support to debug CSS grid layouts. You can now hover over an element in the DOM and Chrome will display the details of the grid in which this element is involved.
For more information regarding web development or to be sure not to miss an update, follow me on twitter.