In this post, we will see how to detect issues with the user experience of your web application with the Performance and Memory tabs in the Chrome Devtools.
Performance Tab
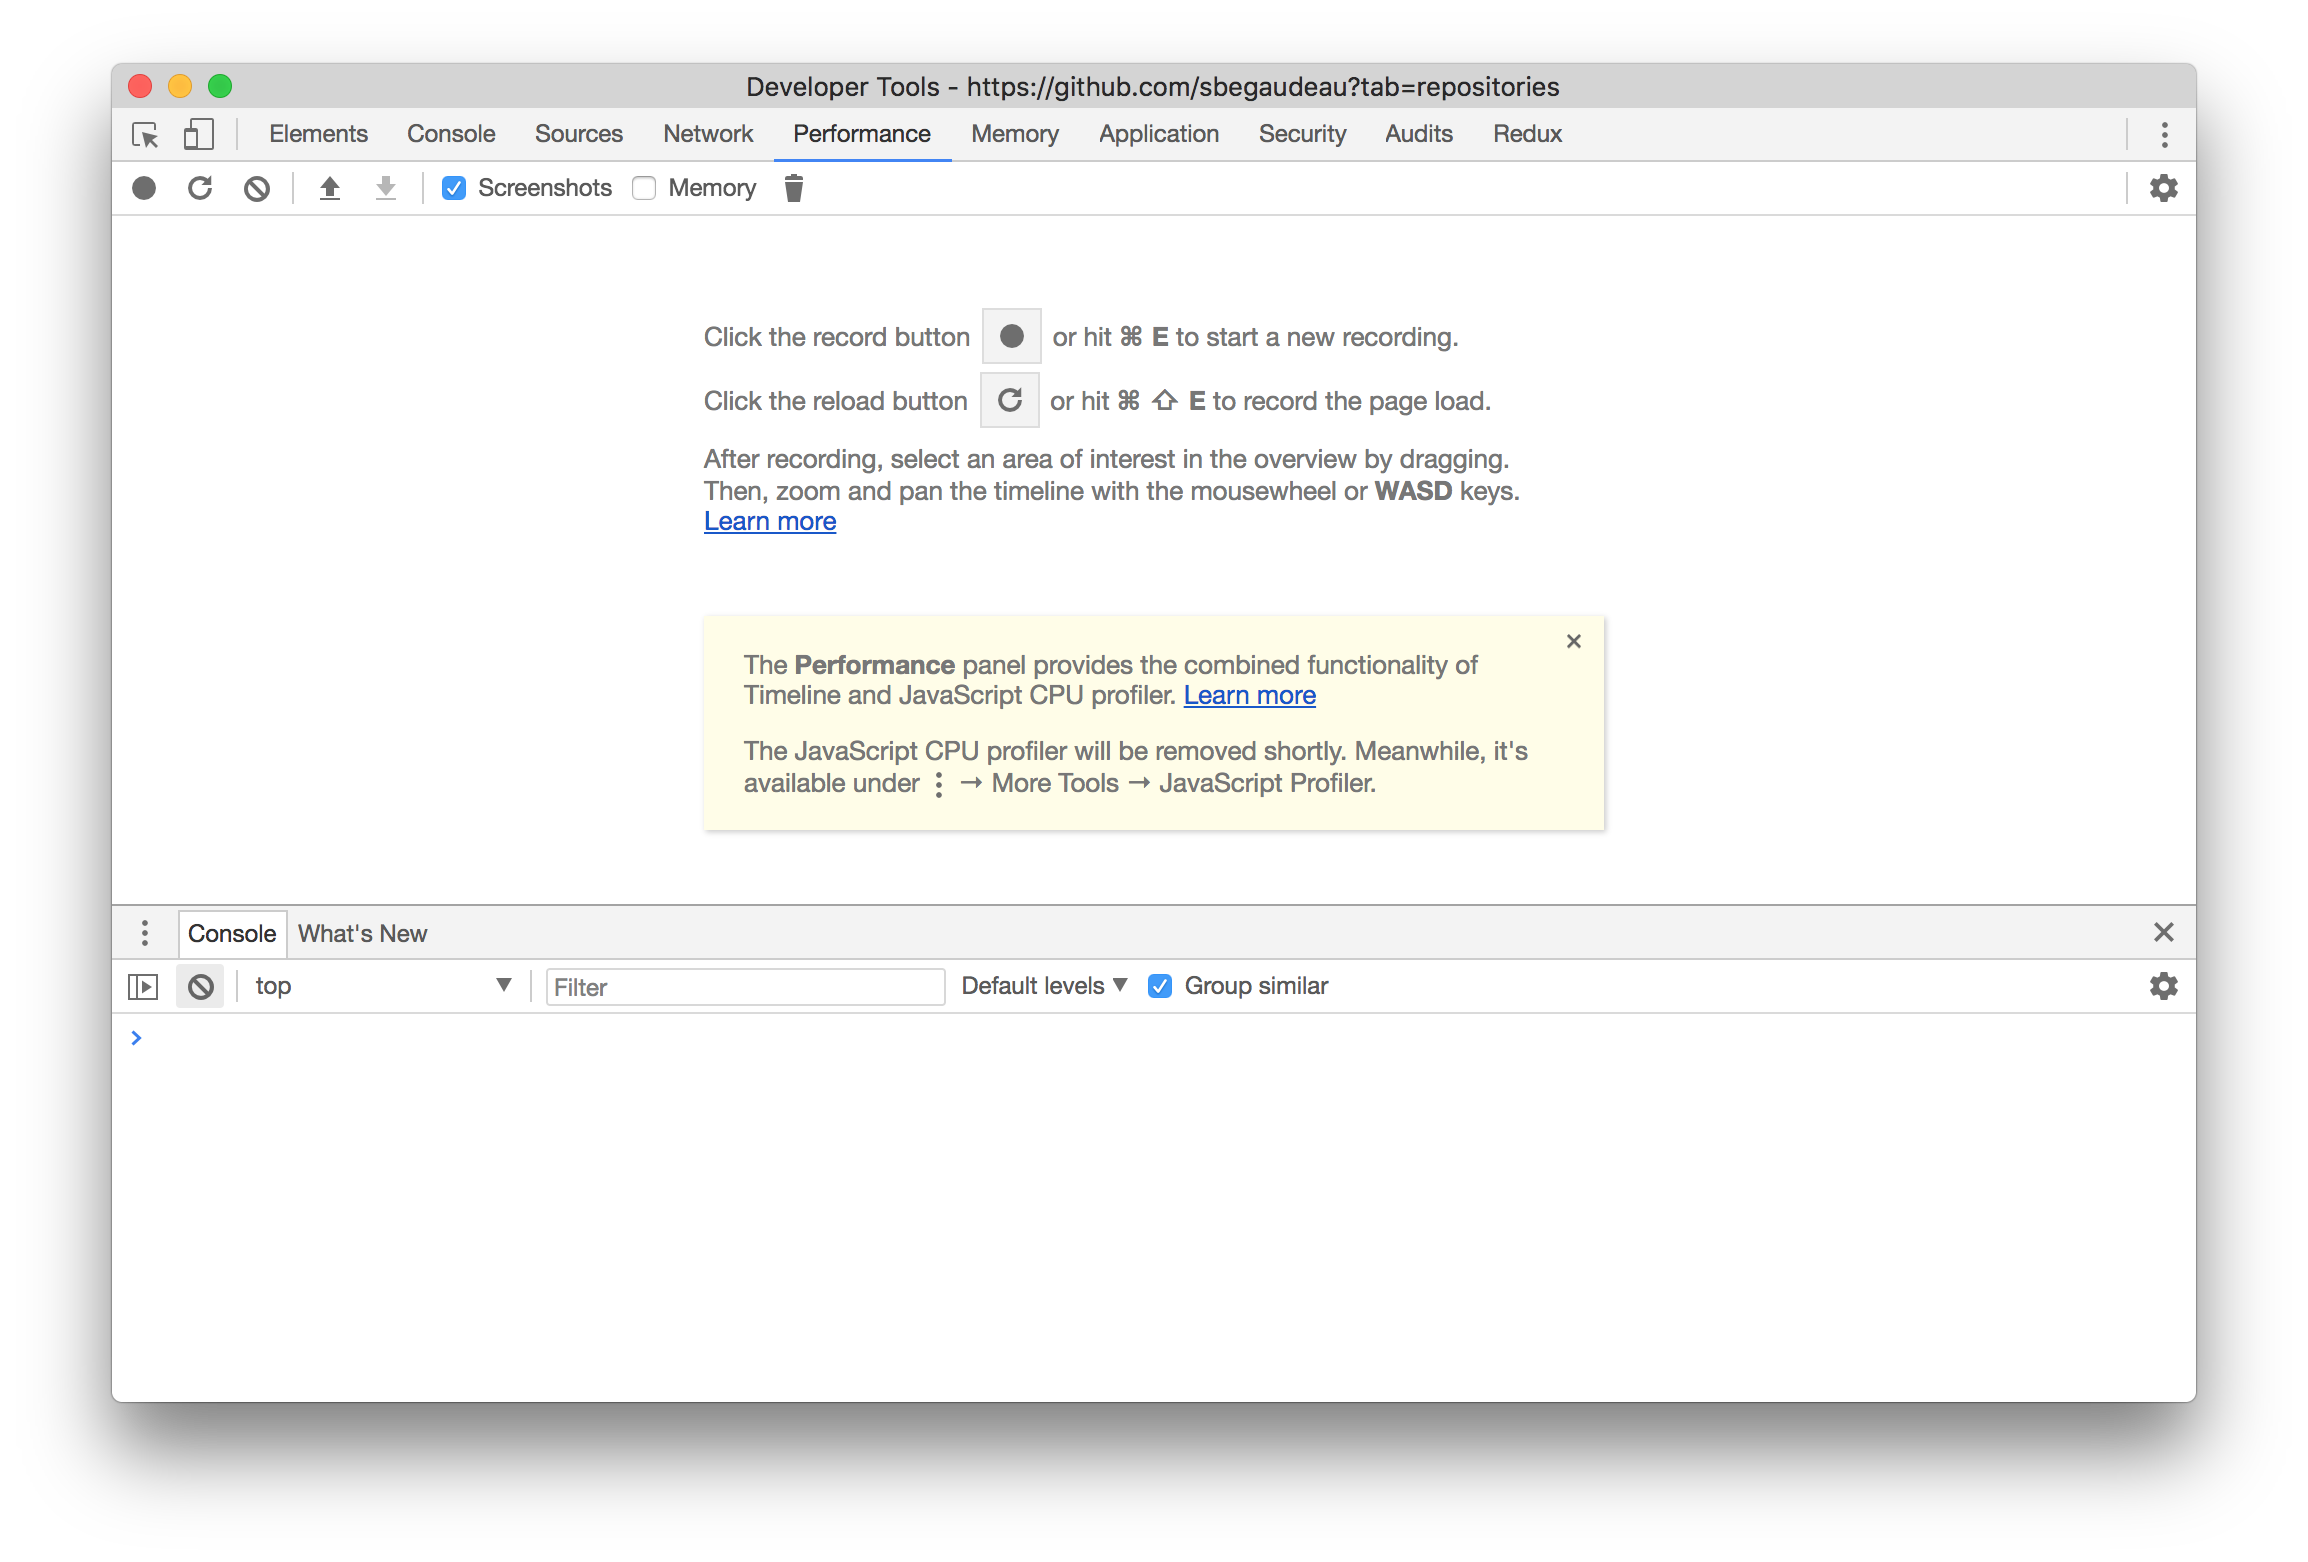
Chrome contains a complete web application profiler in its Performance and Memory tabs. With the Performance tab, it is possible to record everything happening in your web application. You have the ability to start a new recording with ⌘ + e (Mac) Ctrl + e (Win/Linux) or you can force Chrome to start the recording while reloading the page. This second option will let you measure the performance of the loading of your web application. Both options are also accessible from the toolbar with the record and the reload buttons.

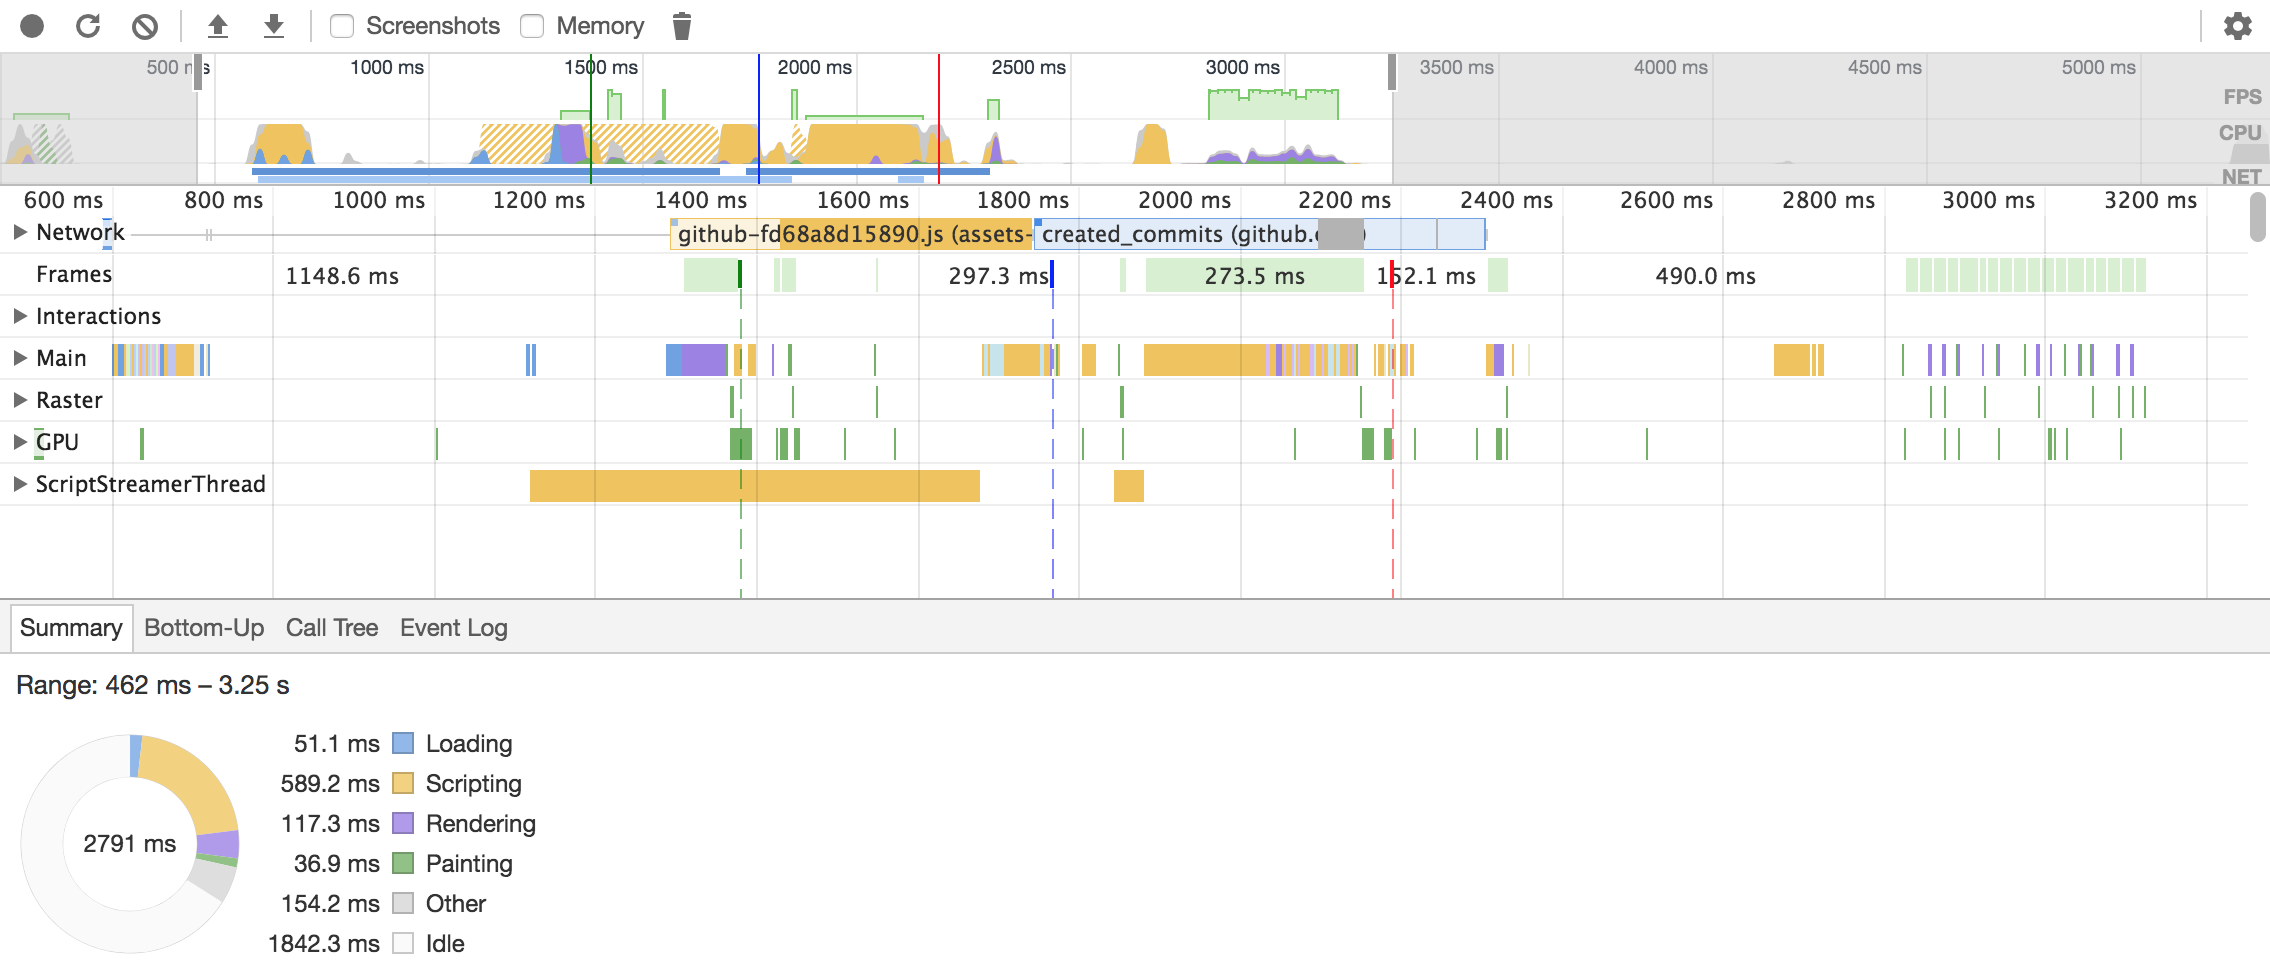
When you have captured the result of a profiling, it will be opened automatically by Chrome. You can save and load any session thanks to dedicated actions in the toolbar. There are three parts in the results of a profiling session. At the top, you have an overview of the session, in the middle you will have all the details and at the bottom, some additional drawers can be used to access additional information.
Overview
The overview lets you see at a glance how your web application behave. It combines three timelines into one.

On top, in green, the FPS timeline indicates the number of frame per second that your application has achieved. The bigger the green bar is the better. When the green bar is large, it shows that your application is close to the recommended 60 frame per second. If your application is very static like most regular web pages, it’s normal that nothing occurs but if you have animation in your application, you need to keep an eye on this part. If the performances of the web application are critically low, a red bar may appear on top the of green one to indicate performance bottlenecks that you may want to investigate.

Under the FPS timeline, the CPU timeline displays with various colors the CPU load of your application. Each color represents a specific kind of task. The color code used can be seen in the Summary drawer at the bottom of the Performance tab.

The last timeline of the overview is dedicated to the network calls. It lets you see with a quick look when your application has been sending requests and receiving responses from remote servers.

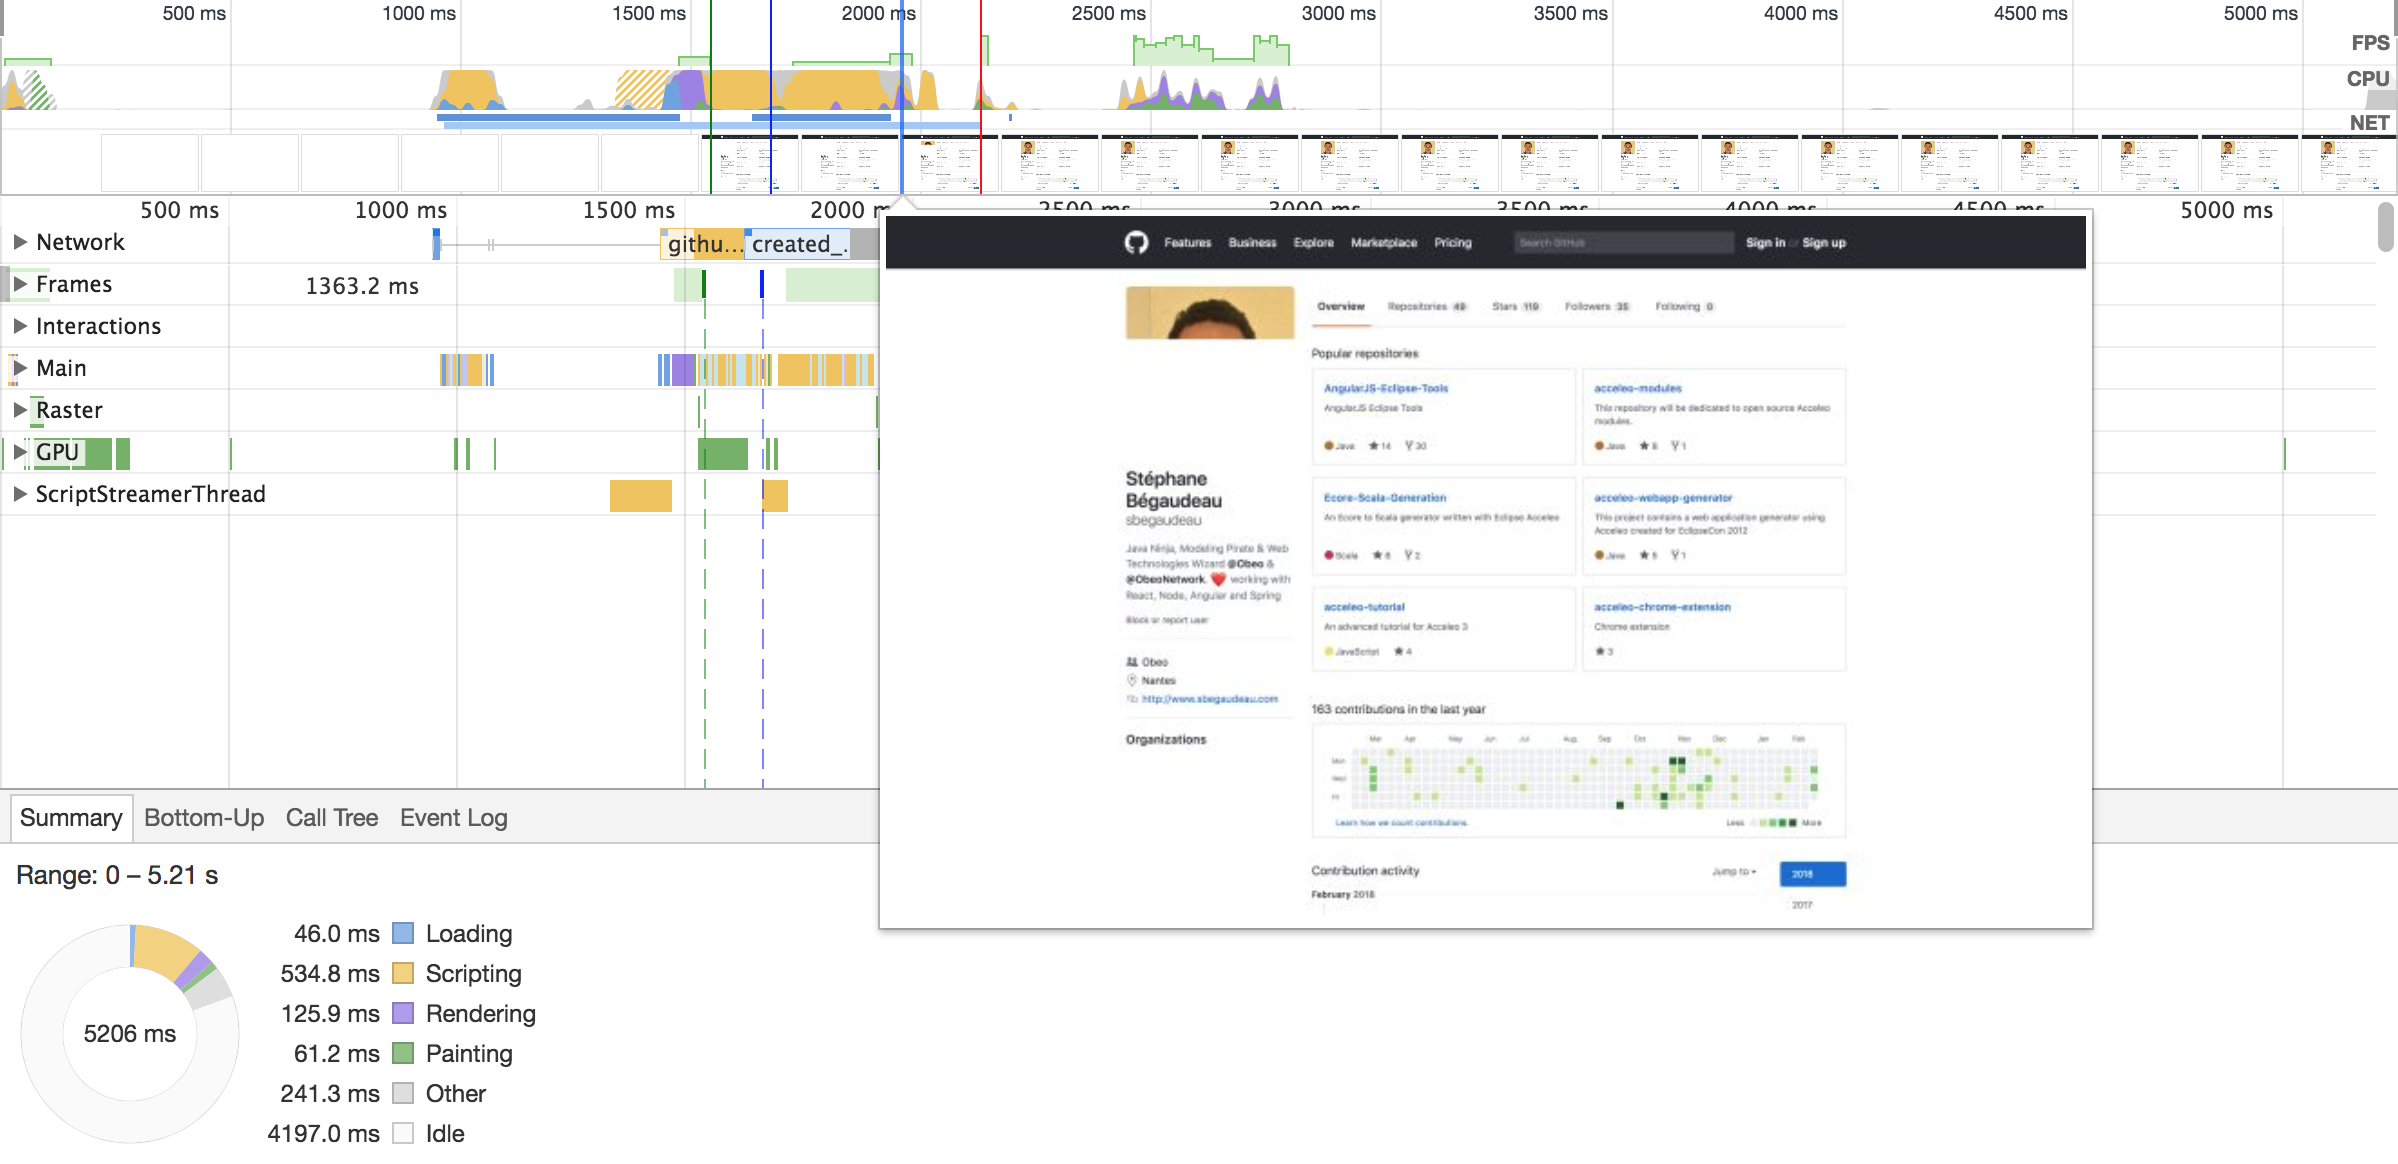
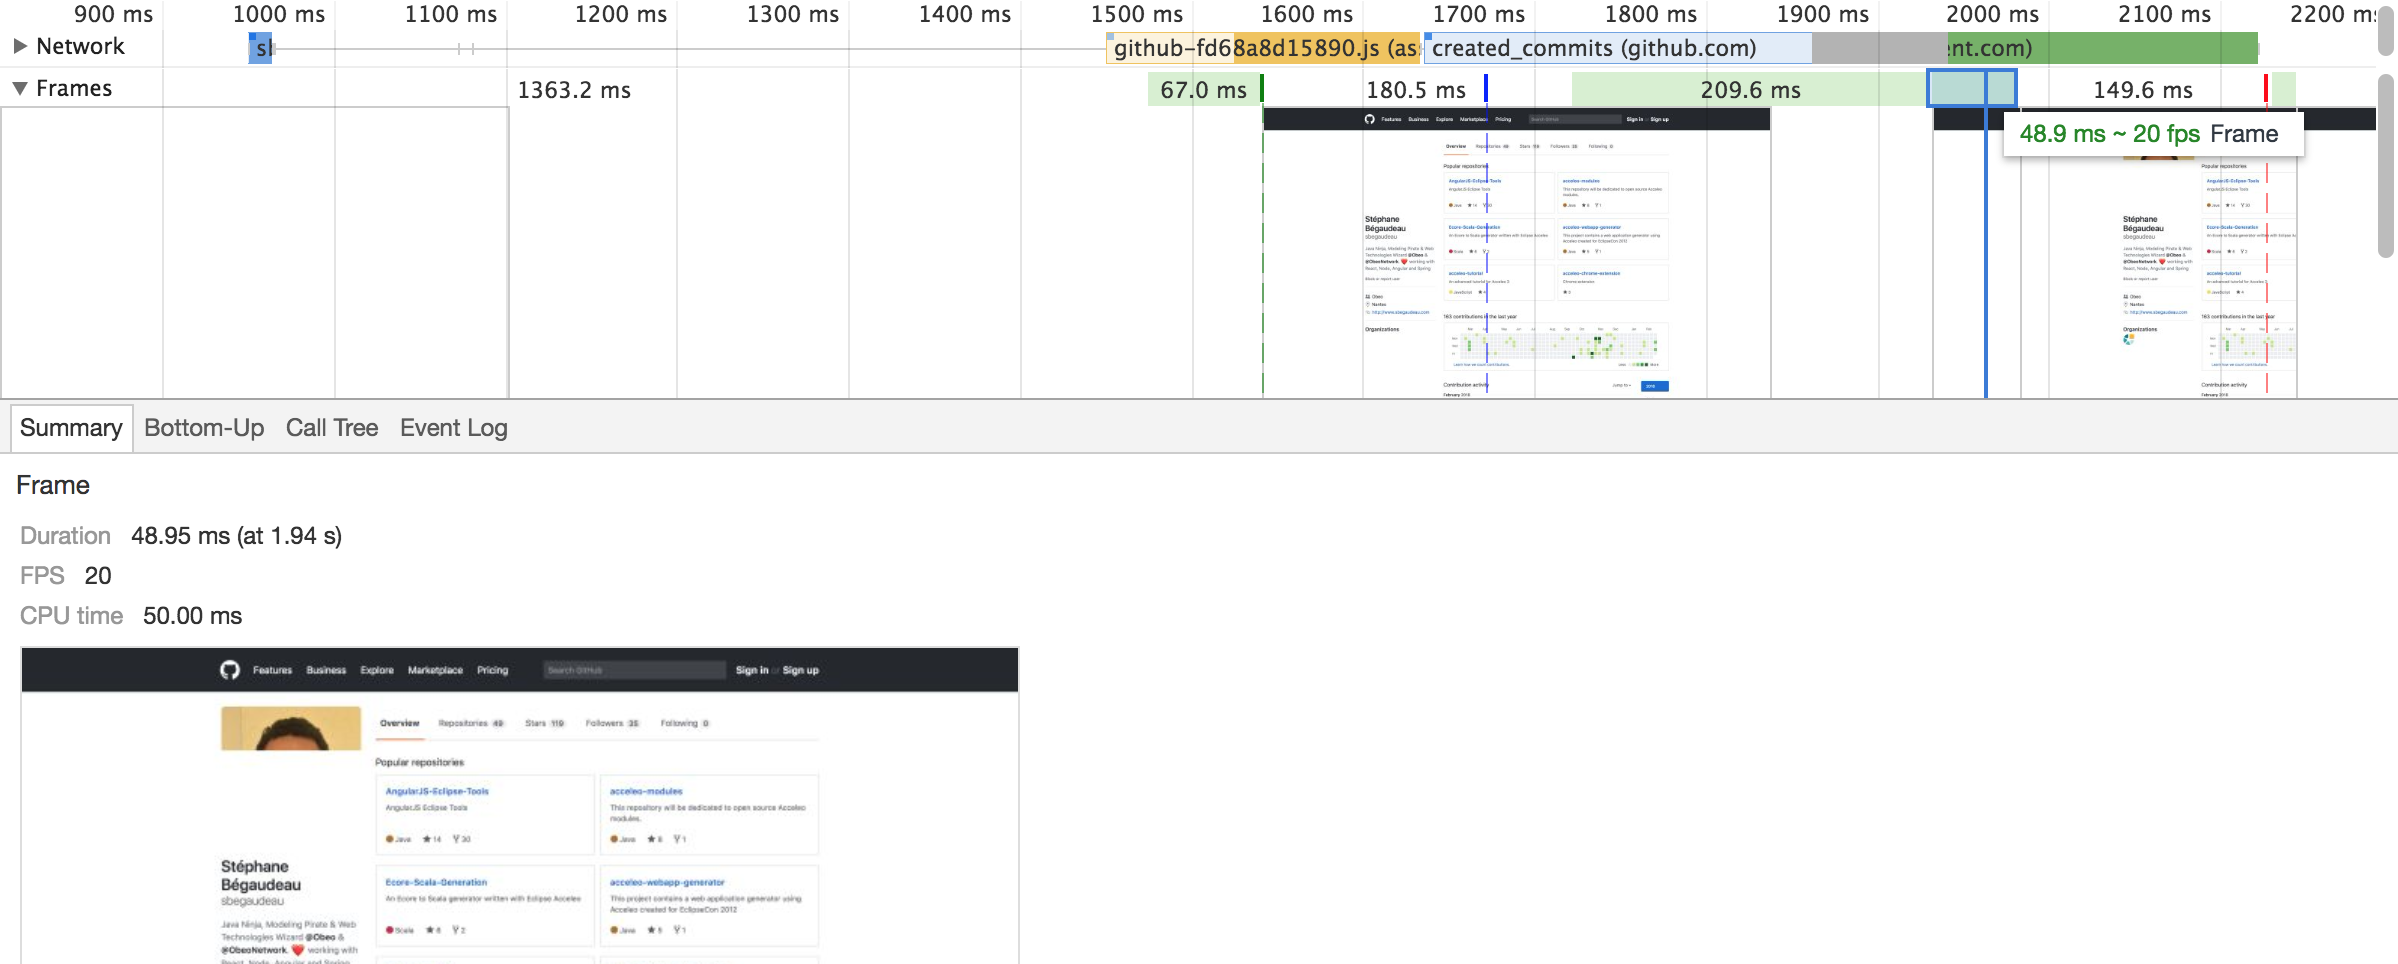
Screenshots
In order to have a better understanding of the events of the timeline, you have the ability to activate the capture of screenshots. Activating the capture of screenshots will display a new timeline with screenshots of your web application showing the state of the application at a given time.

You can move your cursor over the FPS, CPU and Network timeline to see a screenshot showing the state of the application.
Profiling Results
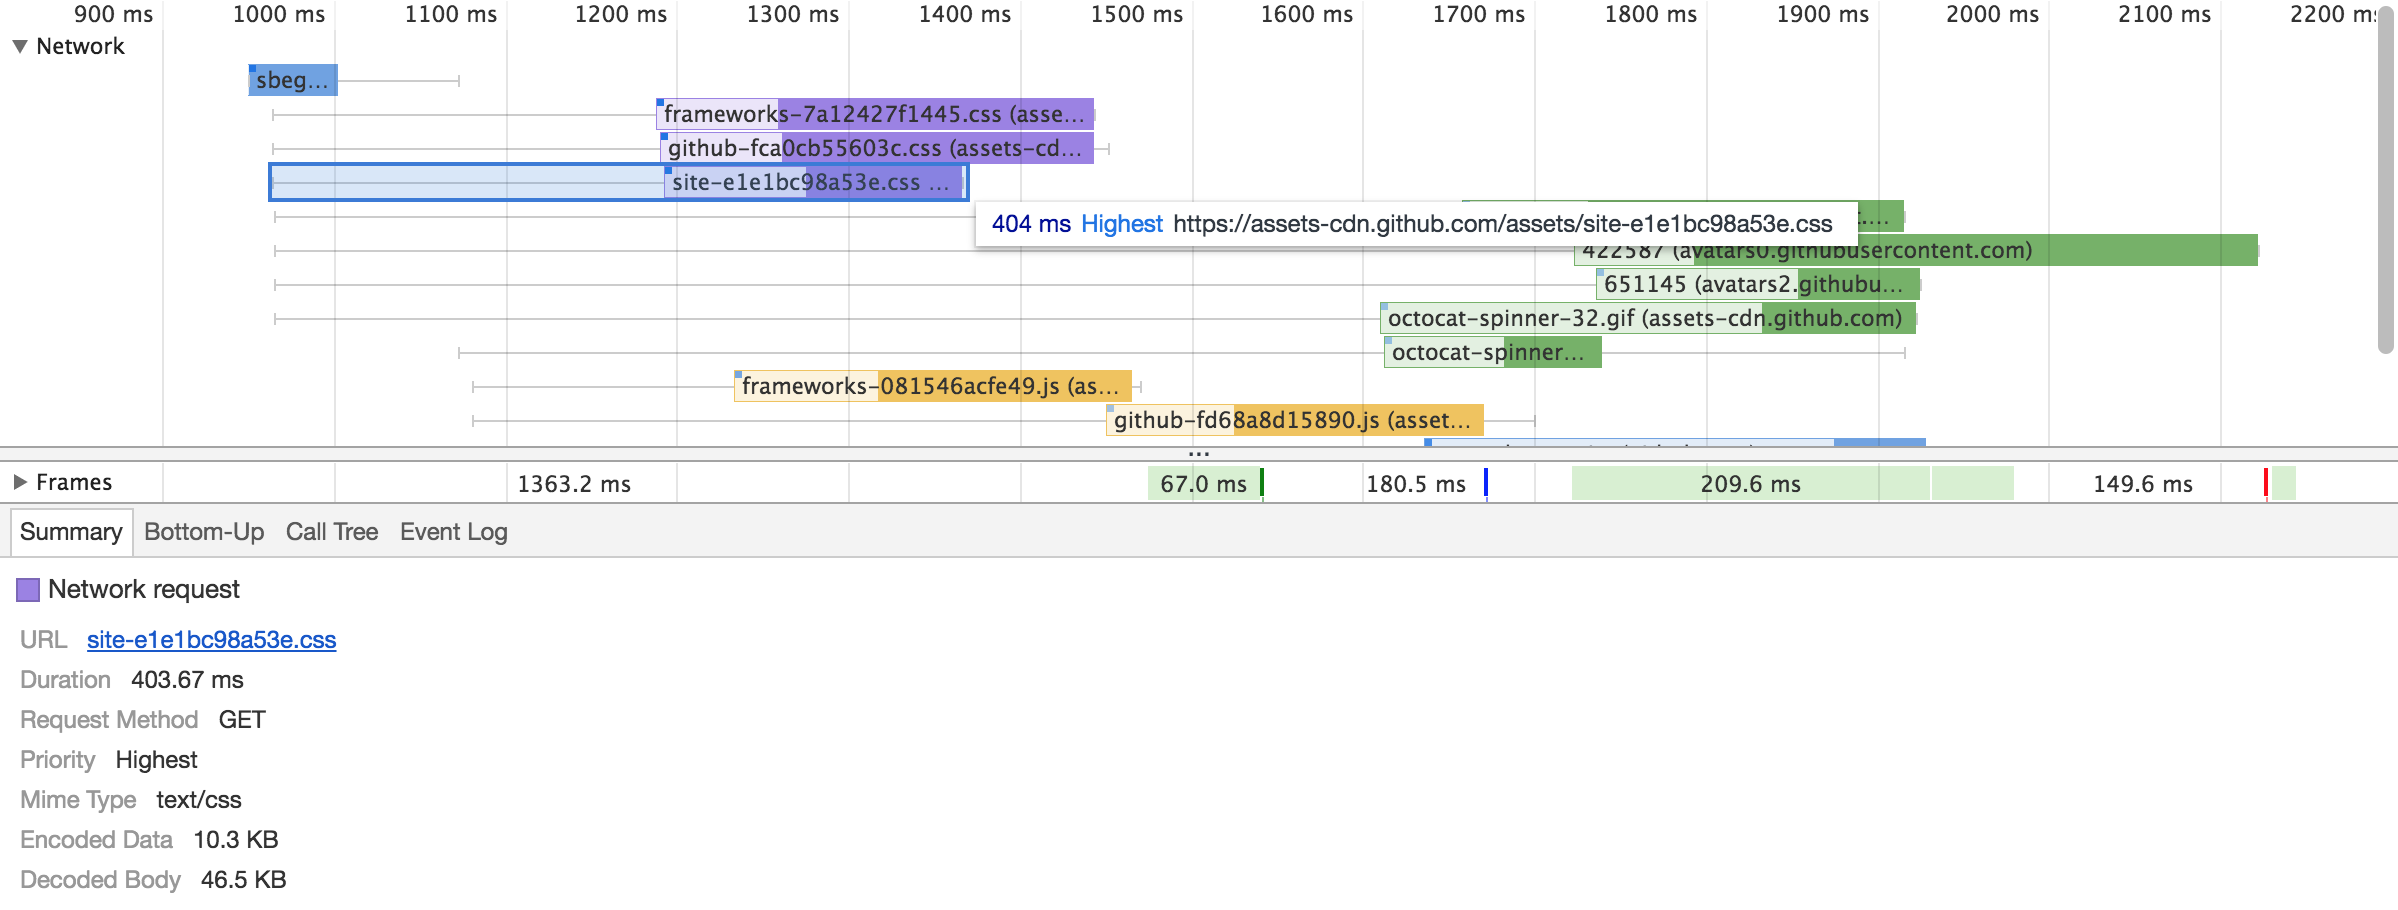
The main area of the Performance tab is used to display the detailed profiling results. We can have a look at the various processes involved in the rendering of a web application. First, the Network part shows the requests impacting the performance of the application. Not all requests have the same priority so don’t hesitate to move your cursor to discover additional details for each request. All the request are also using the same color code as the CPU timeline allowing you to see easily your requests for CSS files impacting on the rendering part in purple while requests for JavaScript files impact the scripting part in yellow.
The Frames part shows the progression of the rendering of the page. You can expand it to see some screenshots of the various rendering steps.
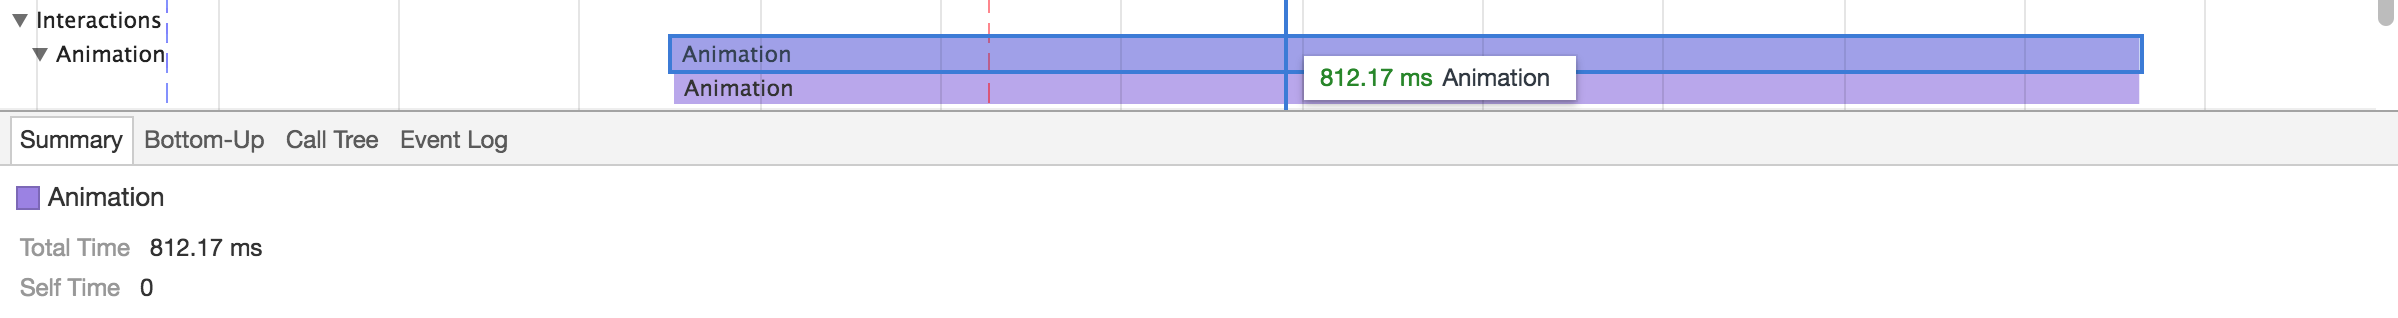
Under the Frames part, the Interactions part displays the various user interactions and animations that have occurred during the profile session.
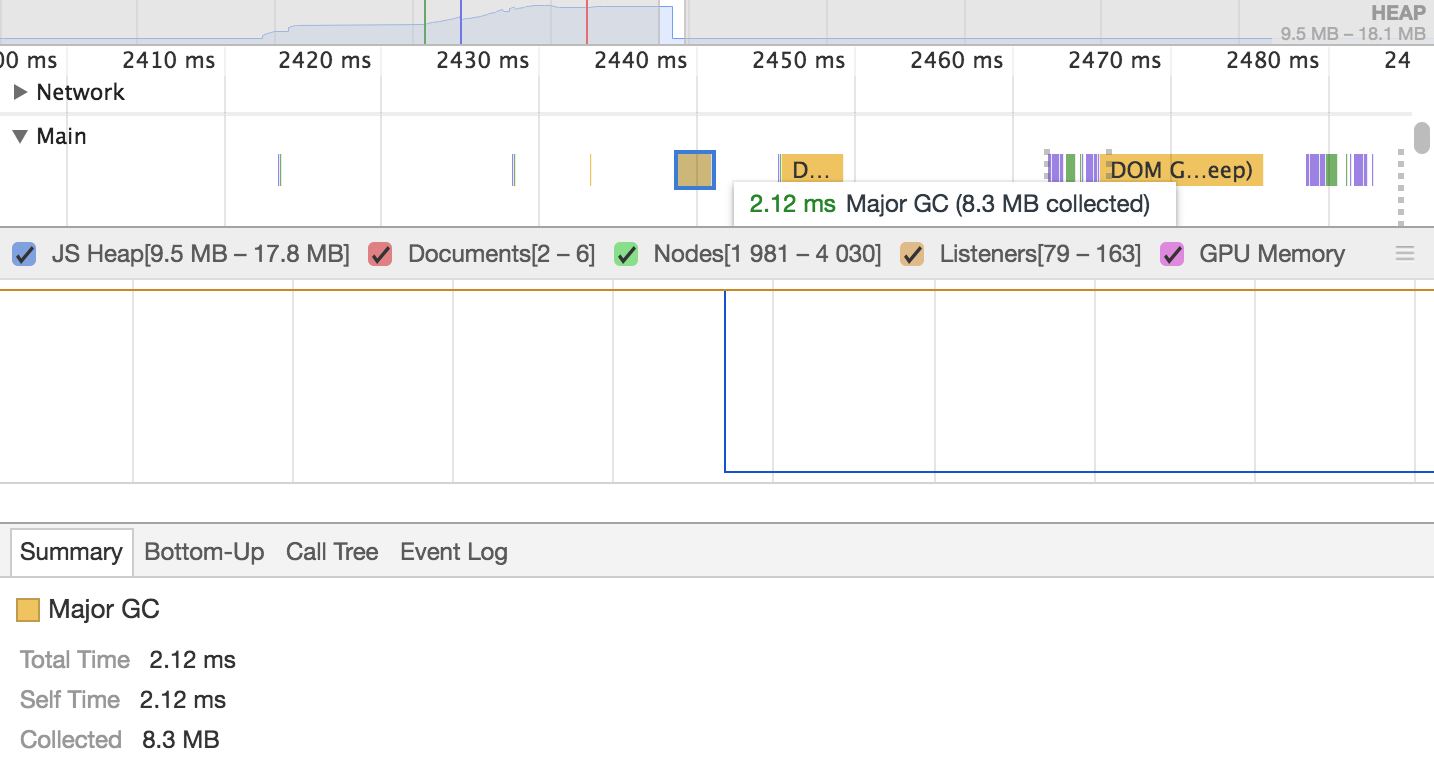
Then you have the Main part in which you can see all the JavaScript code that has been executed. Thanks to your mouse or trackpad you can zoom in and out in any part of the Performance tab and in the Main part, it is especially useful in order to see precisely all the stacks of JavaScript code executed. You also have the ability to click on function references in order to navigate to your code.
The Raster part will show the work of the rasterizer threads impacting the user interface. As an example, it shows Chrome decoding specific images of the current page.
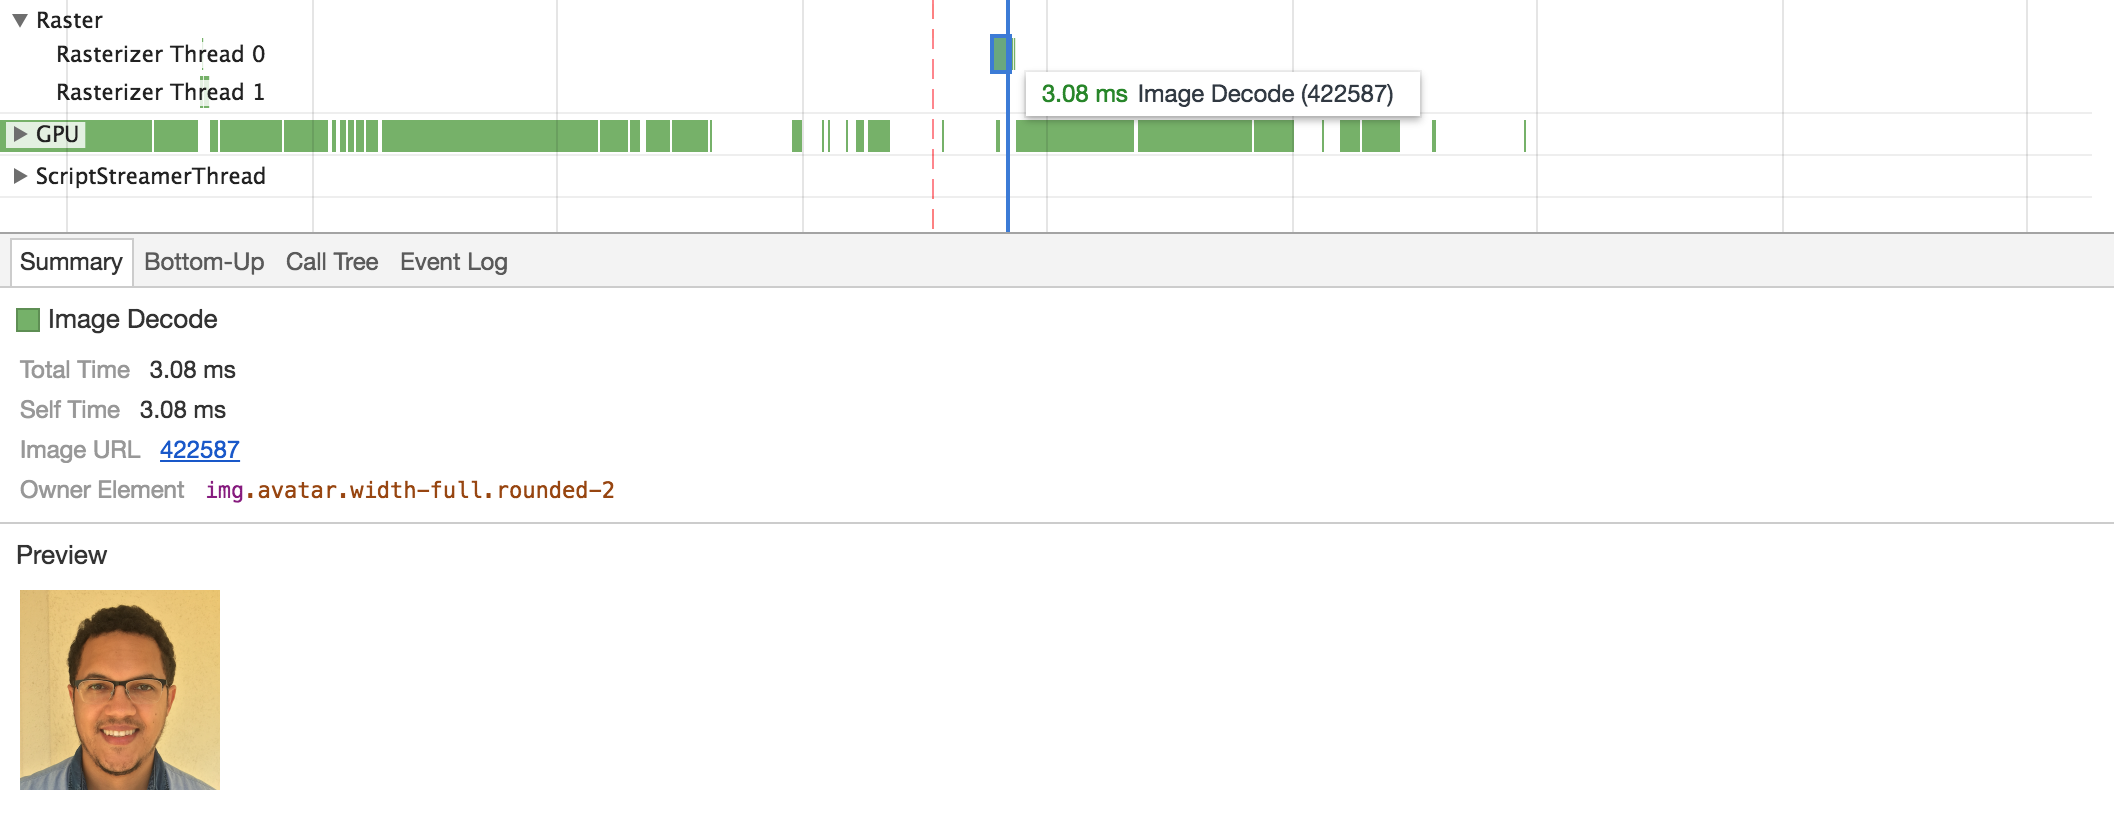
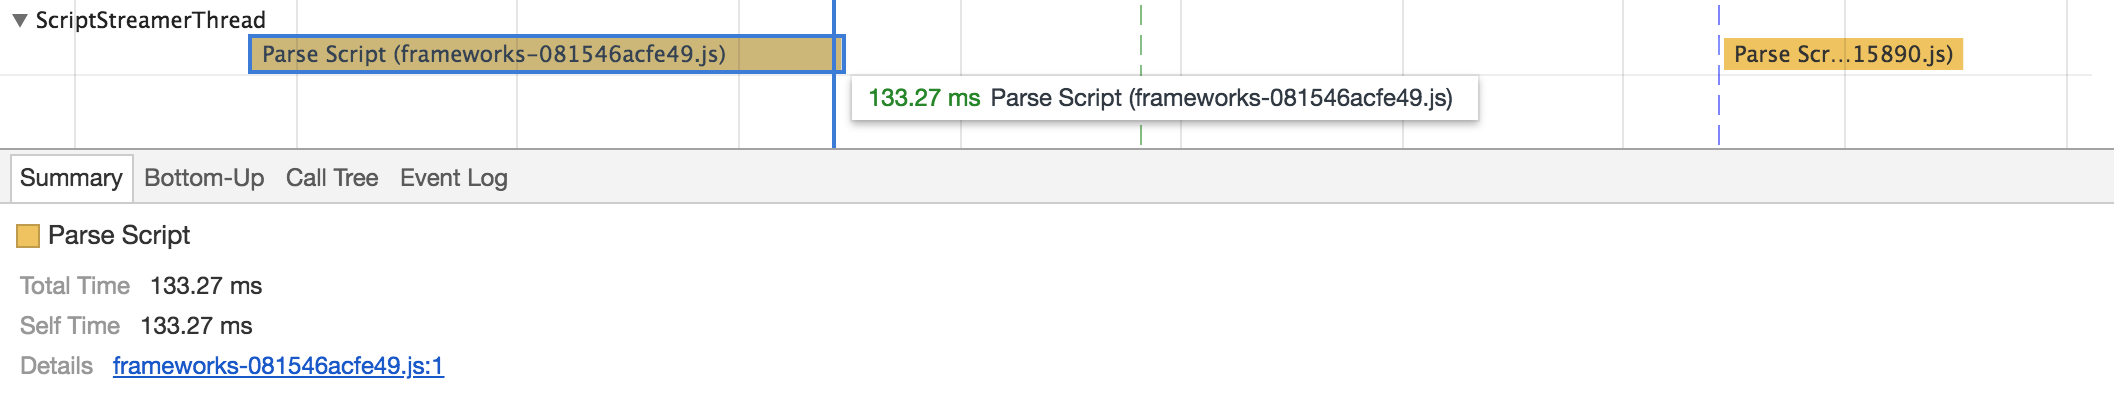
The work of the GPU is visible in its dedicated part. Finally, the ScriptStreamerThread part will let you see the time taken to parse JavaScript. This kind of information is important to highlight the difference in performance between handling a 200kb image and a 200kb JavaScript file. Minifying JavaScript source code can dramatically improve the time it takes to download a JavaScript file but it will not save you from the time necessary to parse and execute such file.
Memory
Thanks to the toolbar, you can toggle the additional memory timeline. This timeline shows the memory consumption of your application over time with a blue bar.

In order to let you understand how the memory is used by your application, activating the memory timeline also displays a dedicated memory area in the Performance tab where you find see in more details the evolution of the memory over time along with the number of documents, nodes, and listeners in your application.
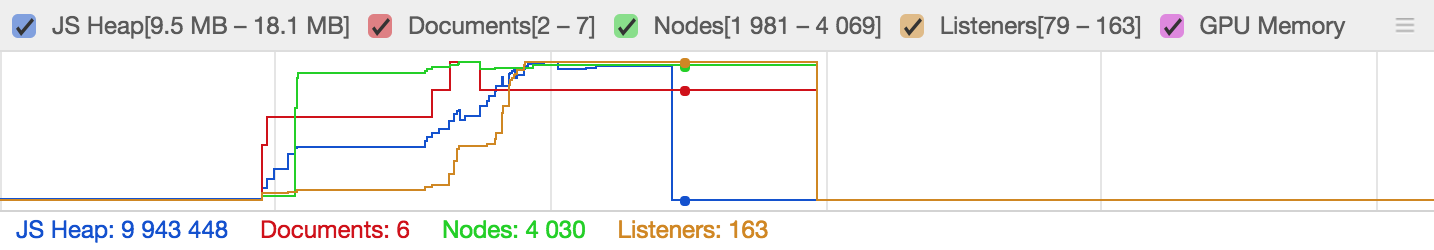
By combining the results of the profiling along with the memory timeline, you should be able to see the events that may have impacted the memory consumption of your application. For example, the memory used by your application will be reduced after the use of the garbage collector.
Additional Drawers
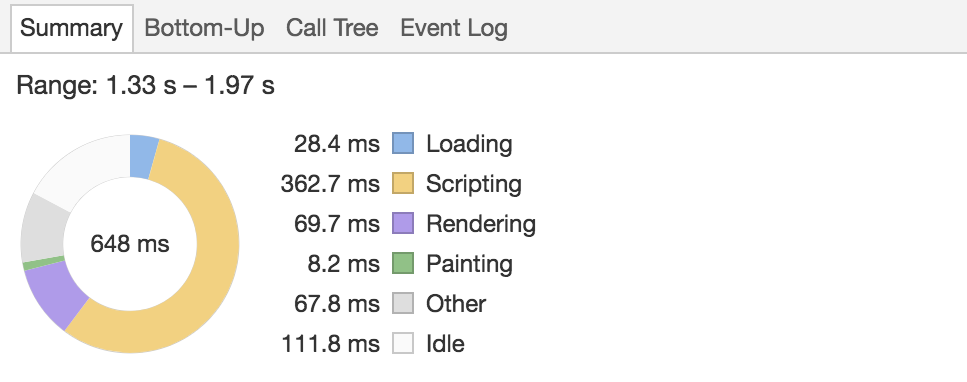
Four additional drawers are available at the bottom of the Performance tab. The Summary tab displays the percentage of the total time taken by the various parts used in the web page.
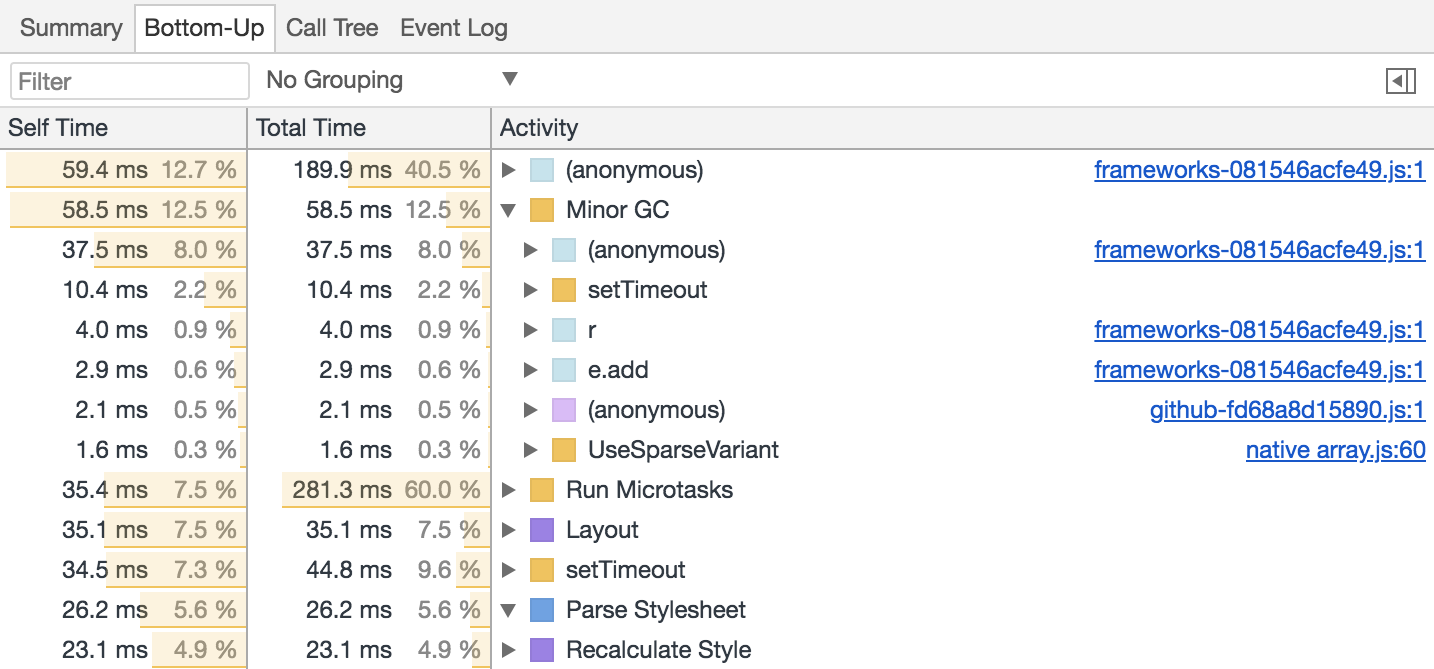
The Bottom-Up and the Call Tree drawers lets you navigate in all the activities executed. They give you the ability to determine which part of your application is the most time consuming and why. You can group the activities by domain, category or even URL.
Finally, the last drawer contains all the events fired by the web application during the profiling session.
Advanced Options
We have seen various tools to let you find performance issues in your application but sometimes (most of the time?) everything will work perfectly fine on your powerful computer with a fiber-optic internet connection. In order to let you manipulate your web application as some of your users will, you can reduce the speed of your network connection and throttle your CPU. This way, even on a powerful computer, your web application will run as if it was on an old smartphone with a slow 3G network.
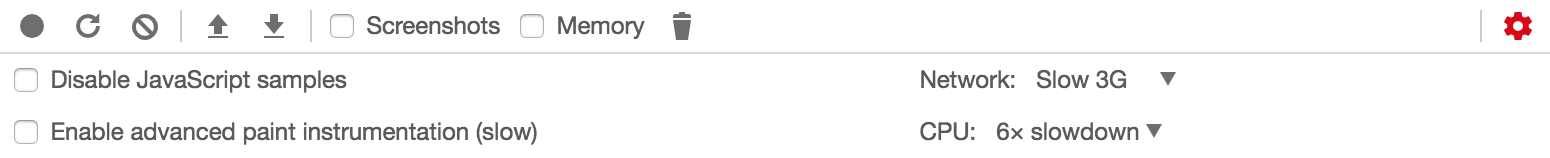
Warnings will appear next to the Network and Performance tabs in order to remind you that you have lowered the performance of your web browser.
Memory Tab
In the Memory tab, you have three main options to get started.
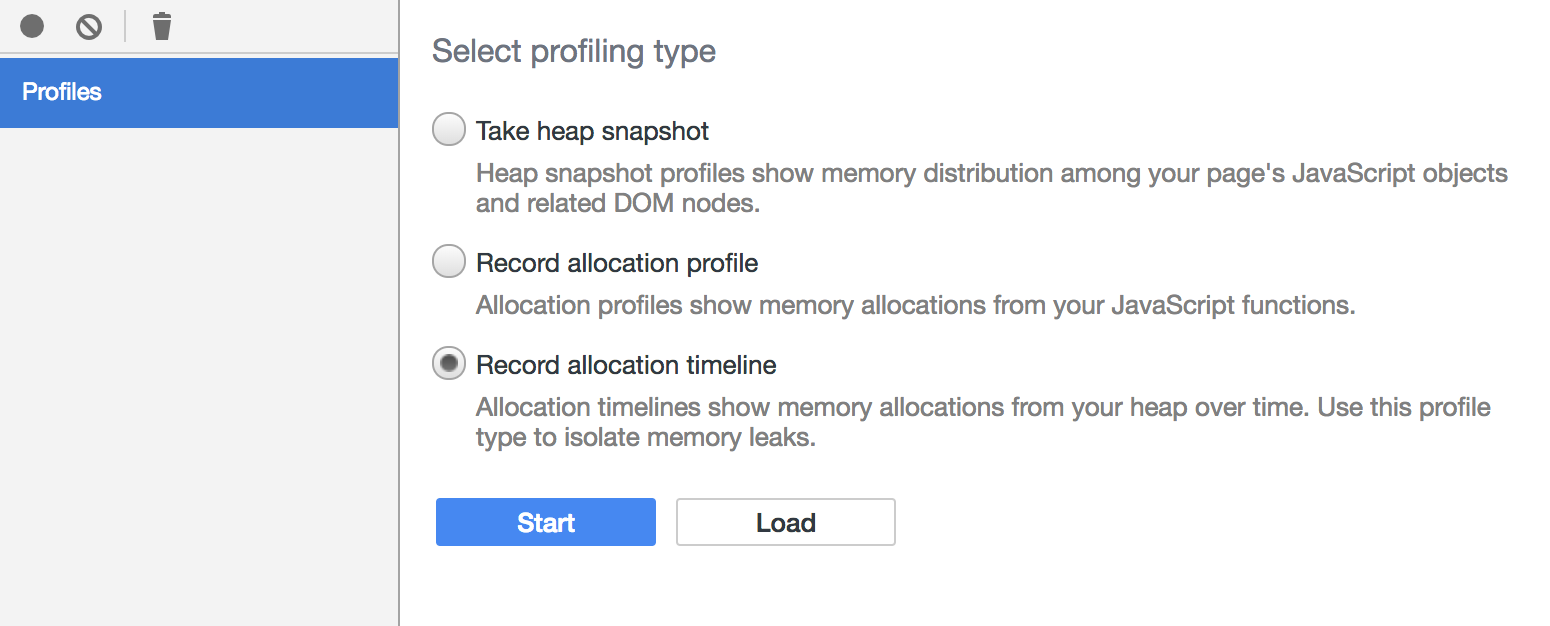
Heap Snapshot
With the Heap Snapshot, you will see the current objects in your heap. A summary is visible with a table showing all the content of the heap with the shallow size, retained size and number of objects for each kind of elements. You can also navigate the Heap Snapshot thanks to the containment relationship of the elements. Keep in mind that the Chrome Devtools will allow you to monitor everything including your Chrome extension which may have a sizable impact on your performances.
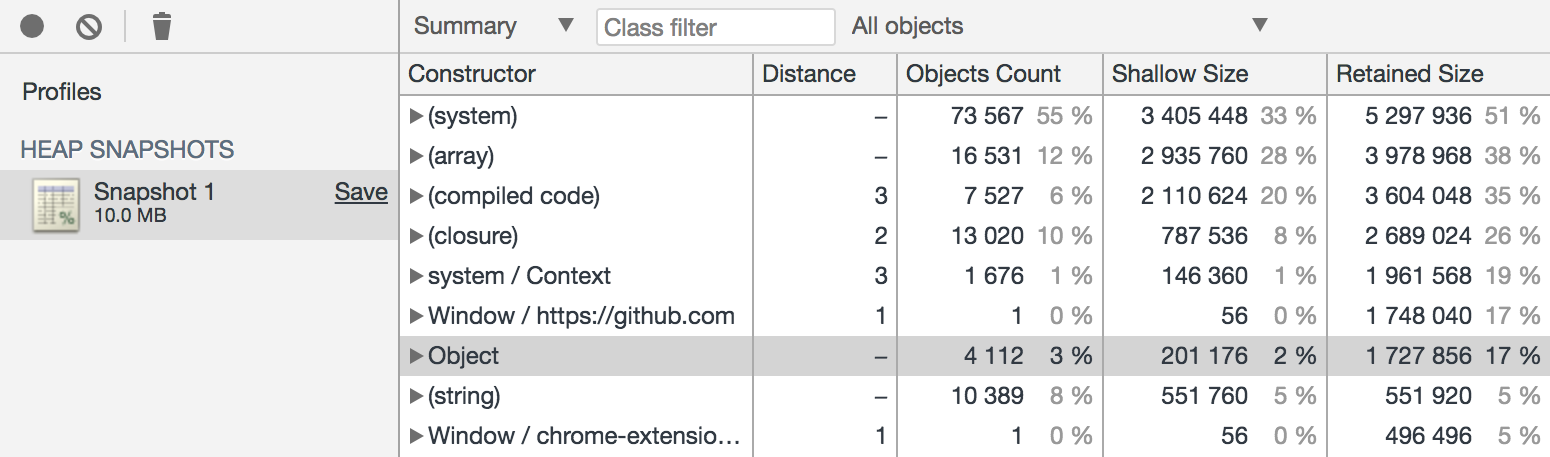
On top of that, some statistics are available in a chart to have a bird’s-eye view of your heap.
Allocation Profile
The Allocation Profile displays the memory allocation of all the JavaScript functions thanks to a chart and two tables.

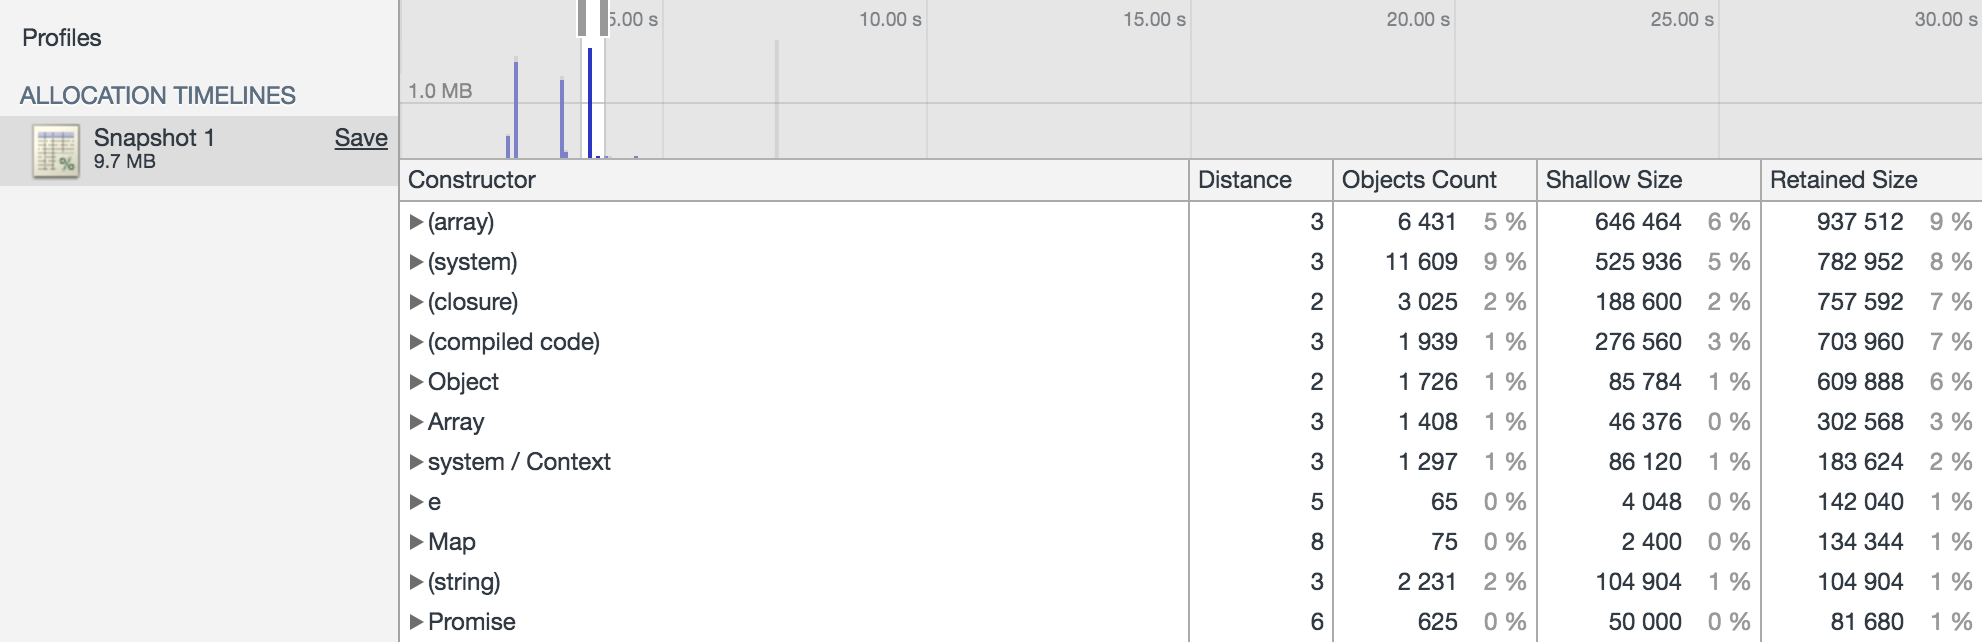
Allocation Timeline
Finally, to fight memory leaks, you can have a look at the Allocation Timeline to see the state of your heap over time.
For more information regarding web development or to be sure not to miss an update, follow me on twitter.