After our tour of the Chrome Devtools Console, we can now have a look at the Network tab. This tab will display all communication between the current page and any server.
General
The Network tab is composed of two parts, on top you will find an overview of the timeline where all the requests that have been made can be seen. Below this overview, the Network tab shows the details of each request. Finally above the timeline, a toolbar gives you access to additional options. By default, the Console is available with additional tools in a drawer at the bottom.
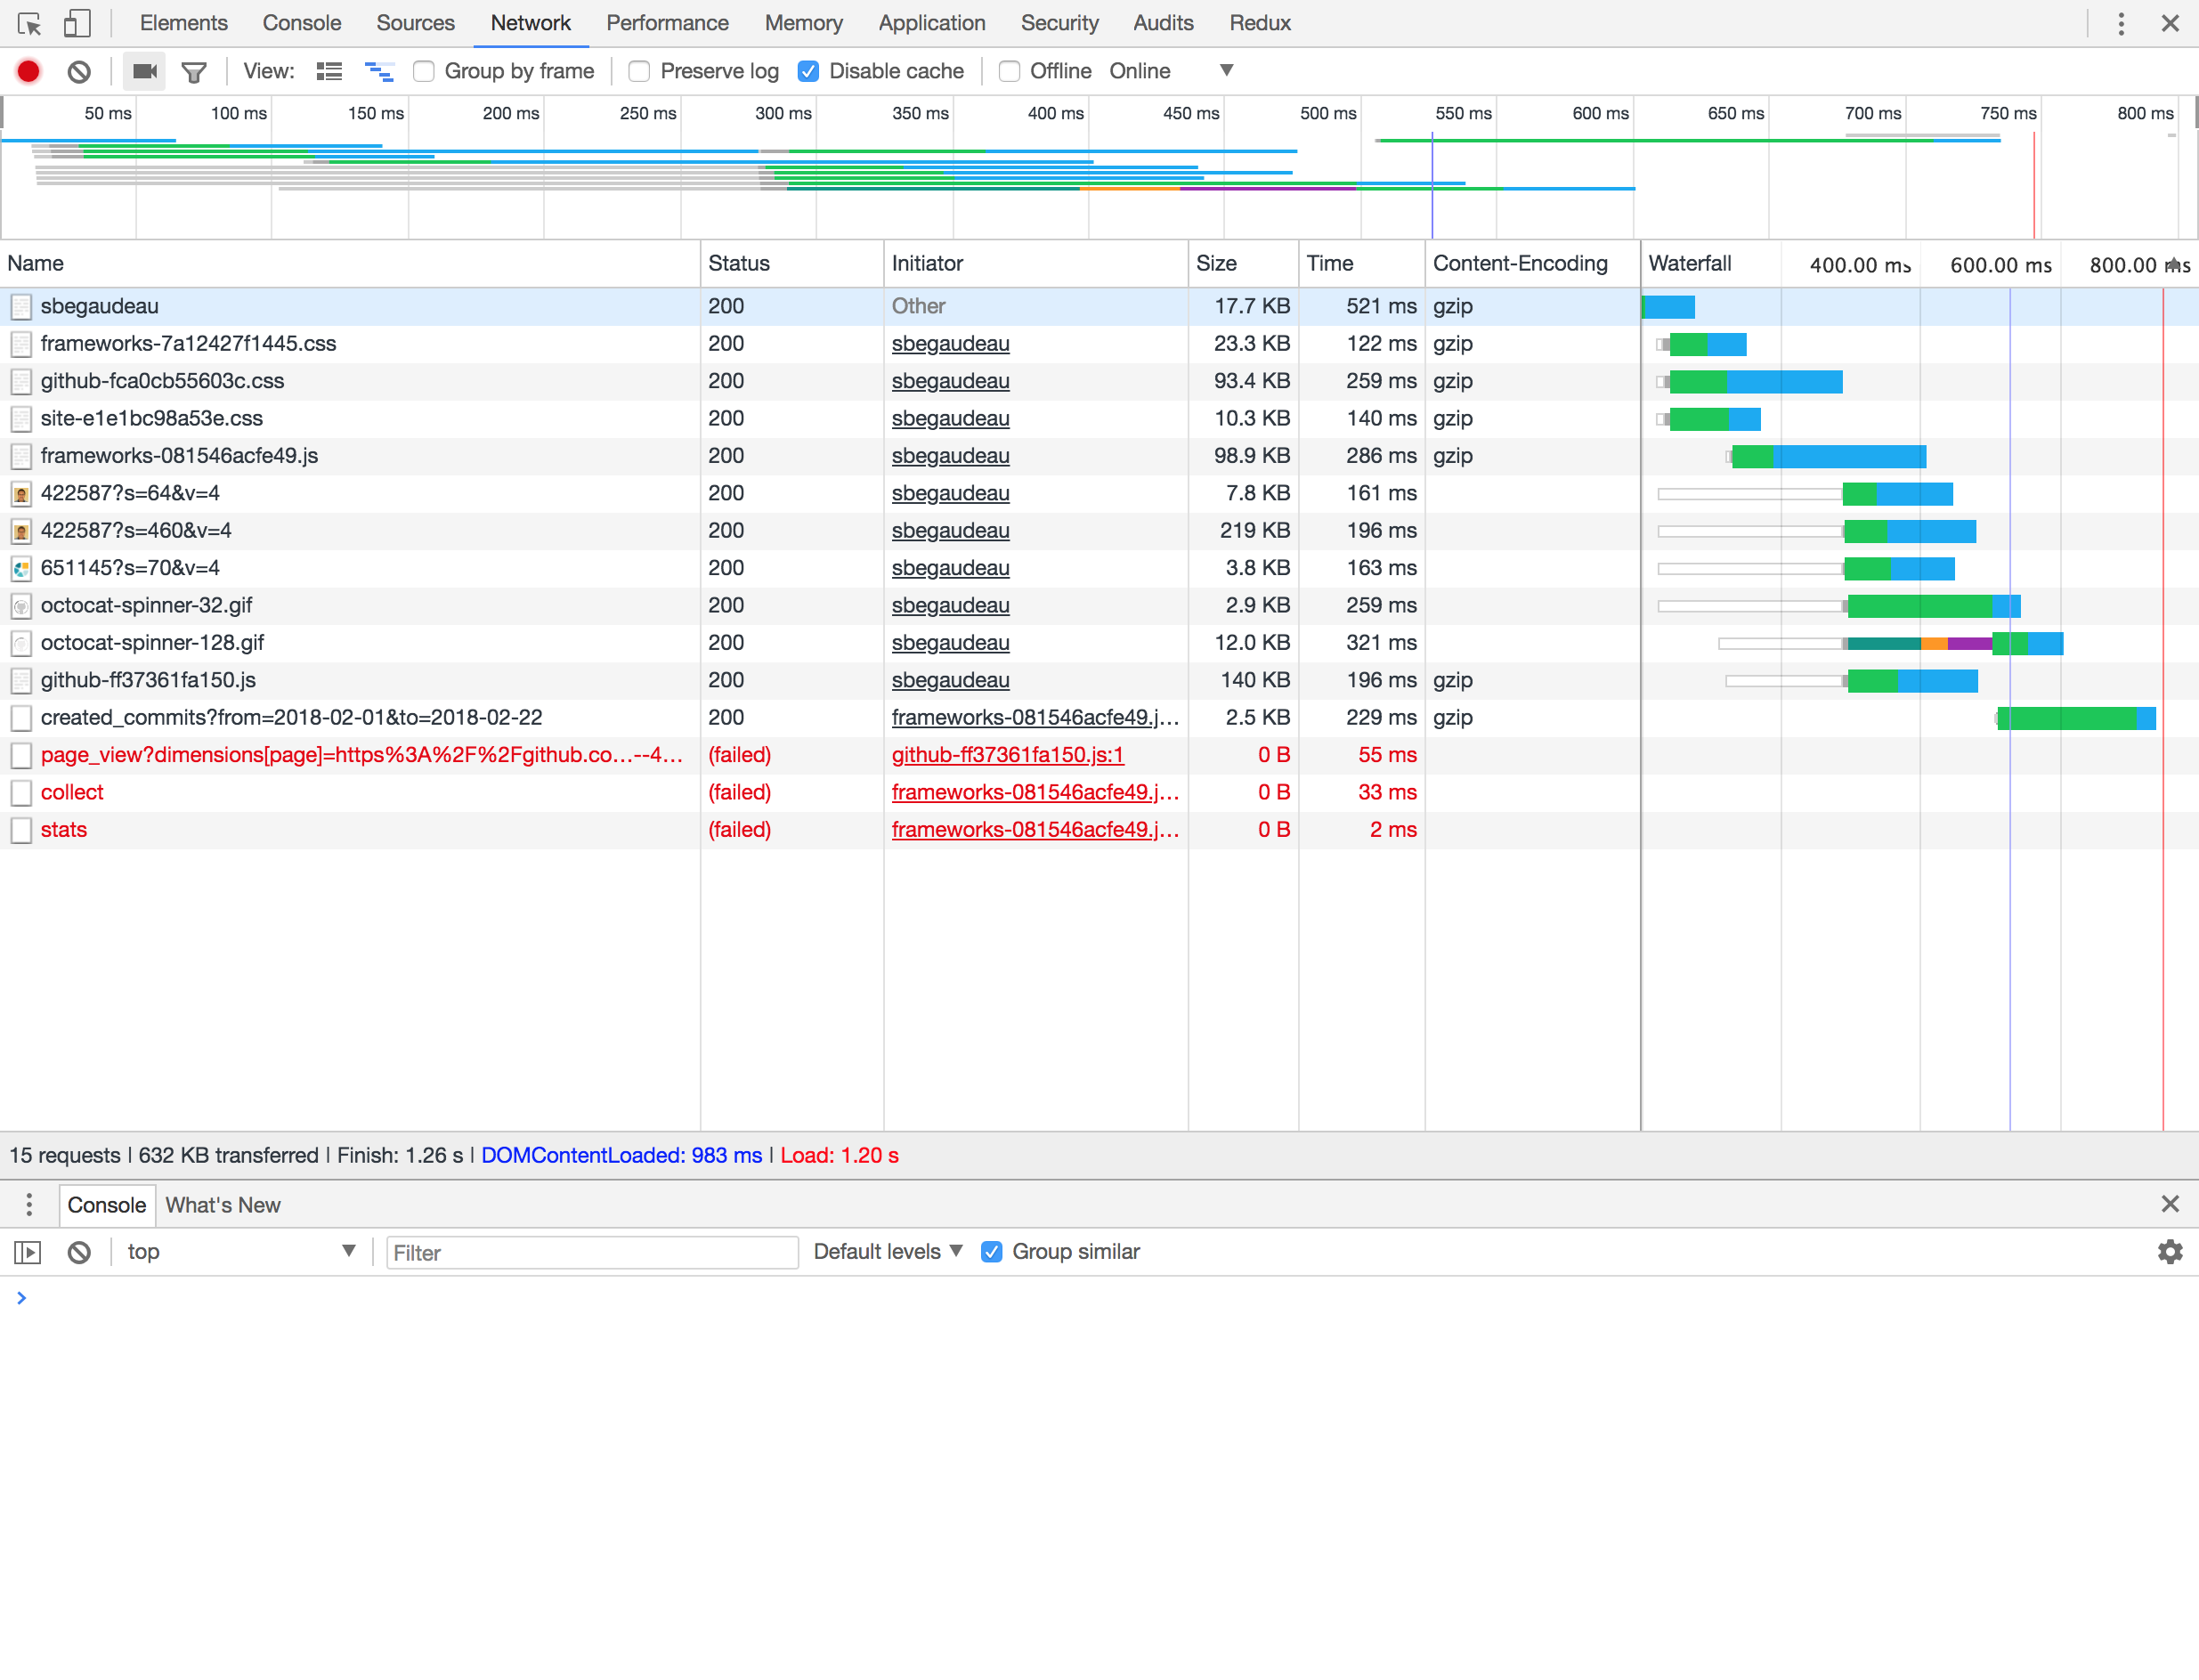
The Network tab will start to record the network activity when a new request will be made or if you reload the page with the Chrome Devtools opened. You can force the reloading of the page with ⌘ + r (Mac) or Ctrl + r (Win/Linux). Use ⌘ + e (Mac) or Ctrl + e (Win/Linux) to toggle the recording of the network calls. When the Network tab is ready to record, a red dot is visible on the top left of the toolbar.
Timeline Overview
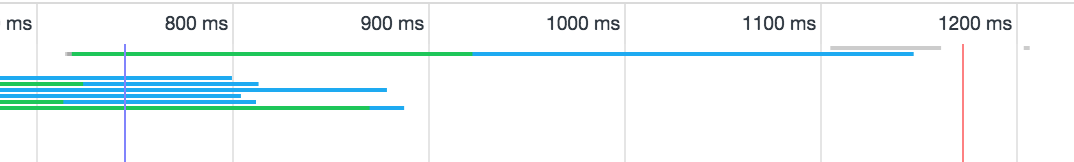
The timeline overview shows all network communication over time. It allows you to select a specific portion of time to review all the calls made. Click on a part of the timeline and Chrome will automatically select a small portion of time surrounding the part you clicked. Double click to go back to the full selection. Use your mouse or trackpad to change the selected area by scrolling up, down, left, or right.
Two small vertical bars are visible in the timeline, a blue one indicating the time it took for the content of the DOM to be loaded and the red one showing when the page was fully loaded.
You can have a look at all the requests made while interacting with your web page directly from the timeline overview. Each request is using a specific color code.
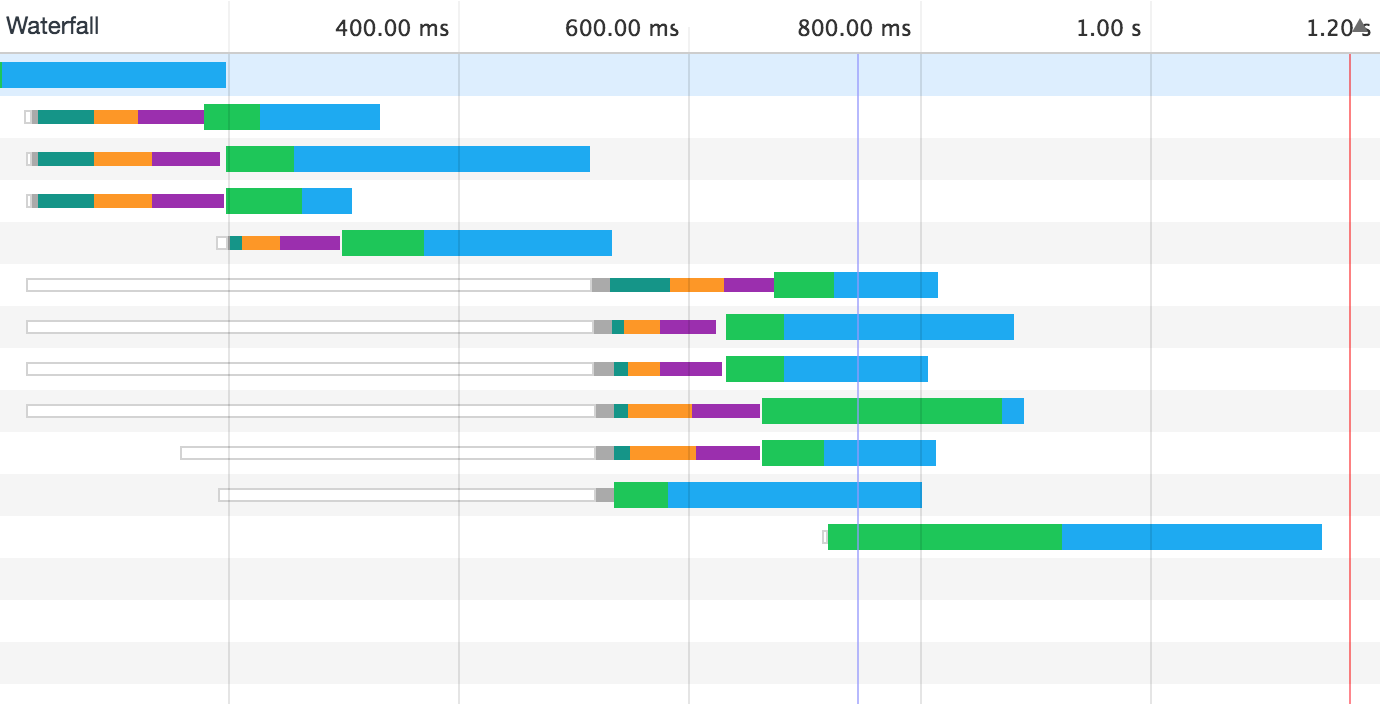
- White / Light Grey - Queueing the request
- Grey - Connection start (Stalling)
- Dark Green - DNS lookup
- Orange - Initial connection
- Purple - SSL
- Blue / Grey - Sending the request
- Green - Waiting for the server
- Blue - Downloading the content
This color code is used both by the timeline overview on the top and the details of each request below. Some patterns of your application will appear clearly such as requests that have been made in parallel while others may be waiting for an event to be made. It becomes easy to spot if some resources are taking a very long time to download from a server.
At the bottom of the Network tab, the status bar displays some statistics regarding the network calls made with the number of requests and the volume of data transferred.

Requests
Under the overview, you will see all the requests that have been made. The details of each request will be represented by a row in the table. By default, you will have at least the name of the resource requested, the status of the request, the initiator, the size of the payload retrieved and a representation of the time taken by each step of the request.

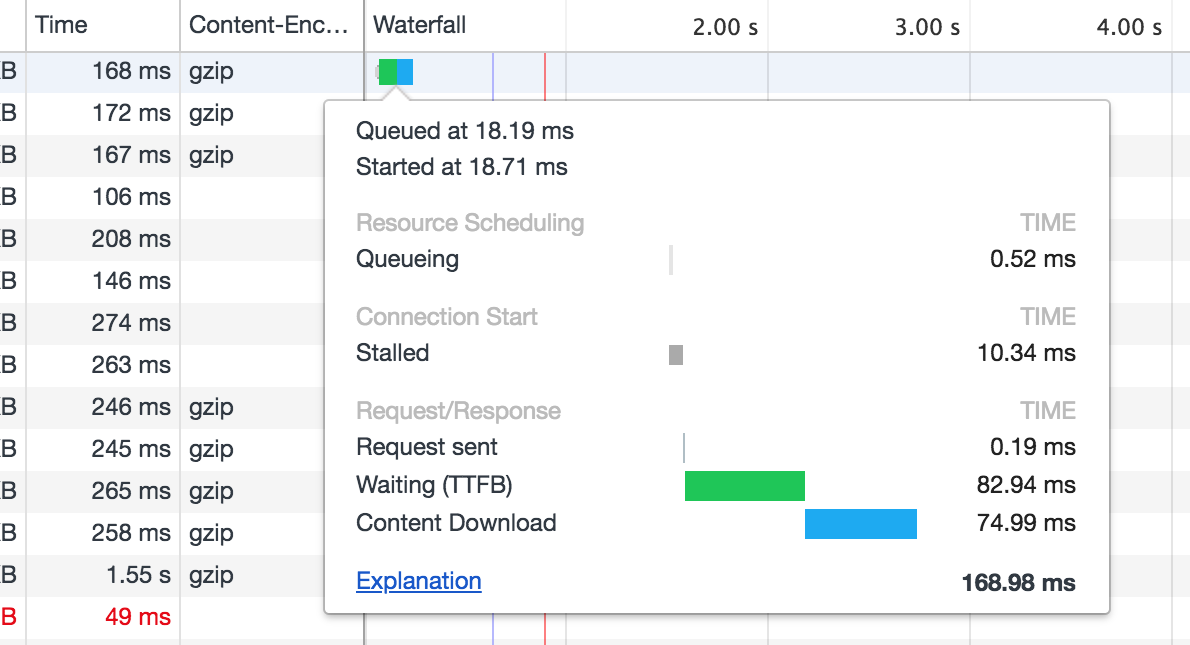
Place your cursor over the waterfall cell of a request to see a more detailed view of each step.
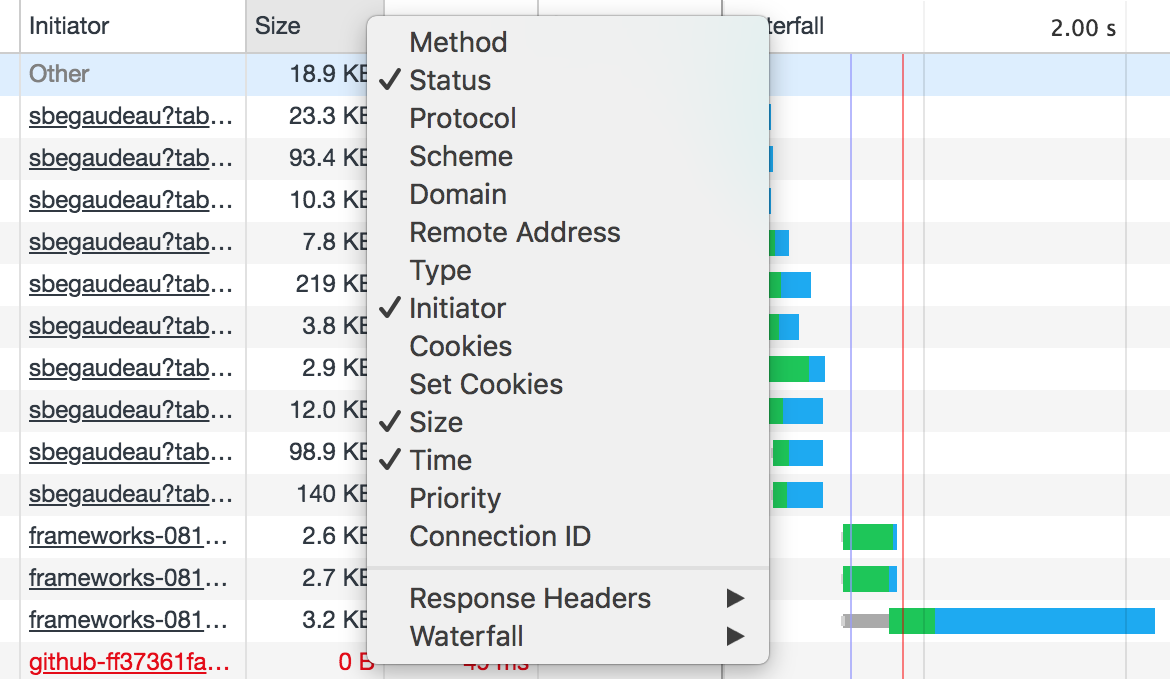
Right-click on the header of the table to modify the columns of the table.
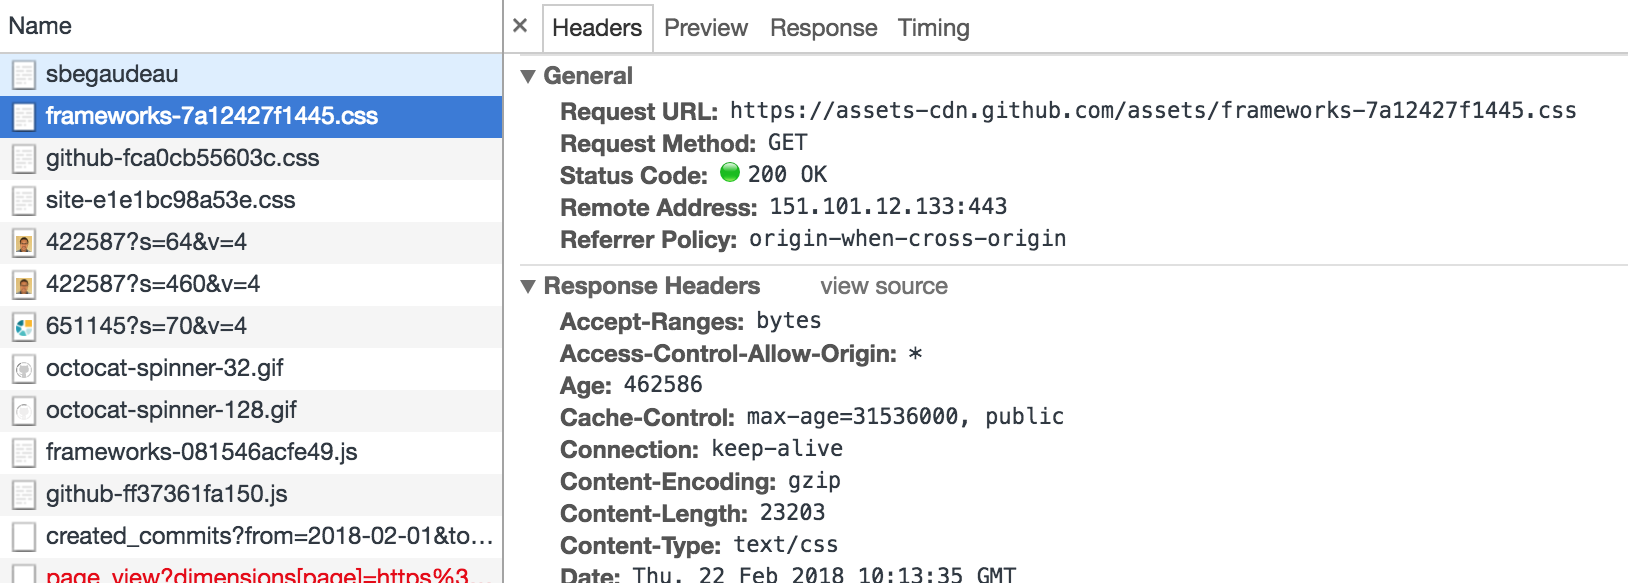
By clicking on a request, you can open a panel with all its details. In this panel, all the headers of the request and the response received are visible. You also see the raw content of the response in the Response tab and a preview in the Preview tab. Most of the time, both tabs will show the same content but for some content types, like JSON, the Preview tab will display a structured view of the response instead of the raw text.
If you want to simulate the user experience of your end users, don’t forget to try your application with some of the most popular browser extensions starting with ad blockers. In the Network tab, requests blocked by ad blockers are visible in red and in the Console, Chrome will log that a network error has occurred because the request was blocked by the client.

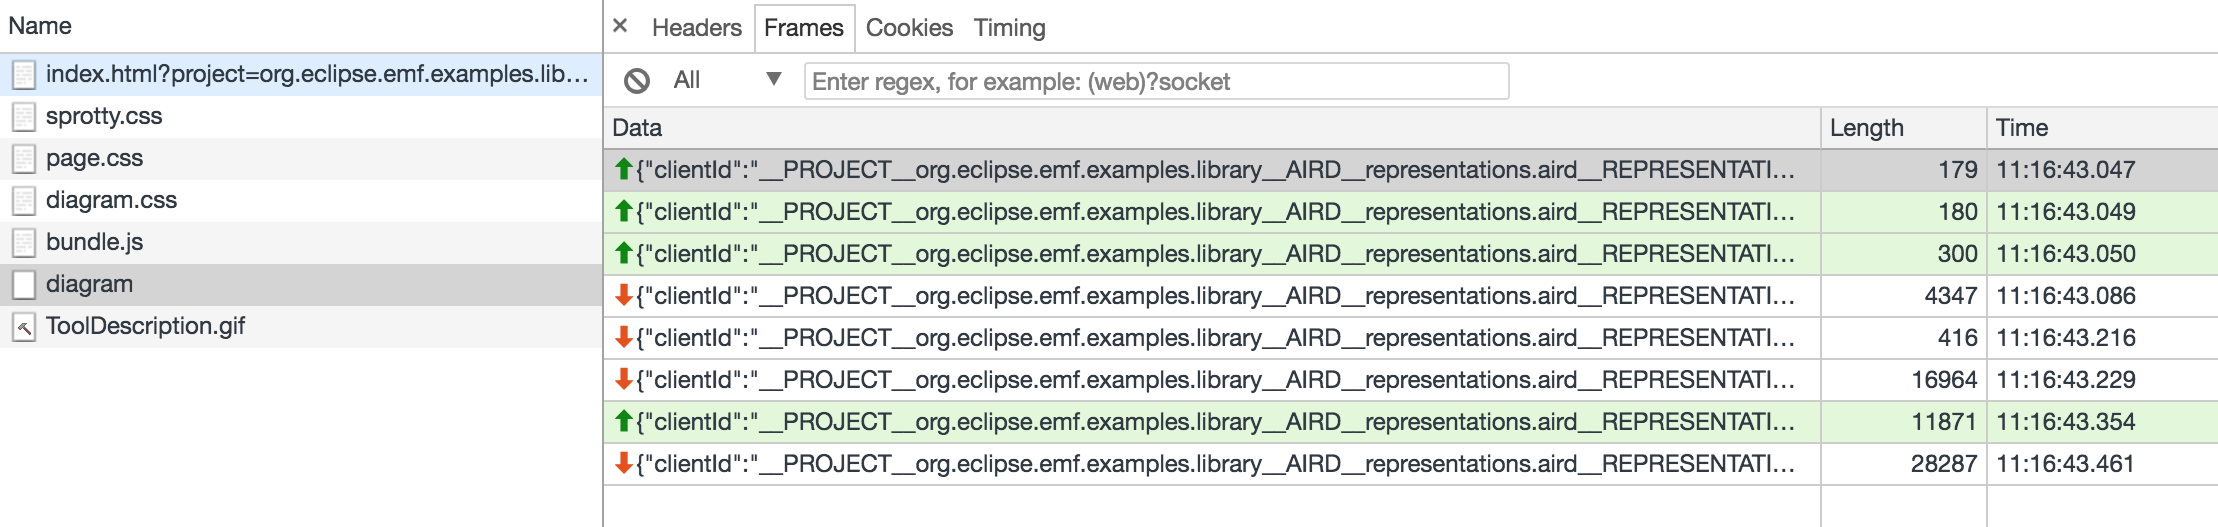
In order to debug web socket communication, you will need to identify the HTTP request used for the web socket handshake. By clicking on this request, you will be able to see all the messages sent and received over web socket.
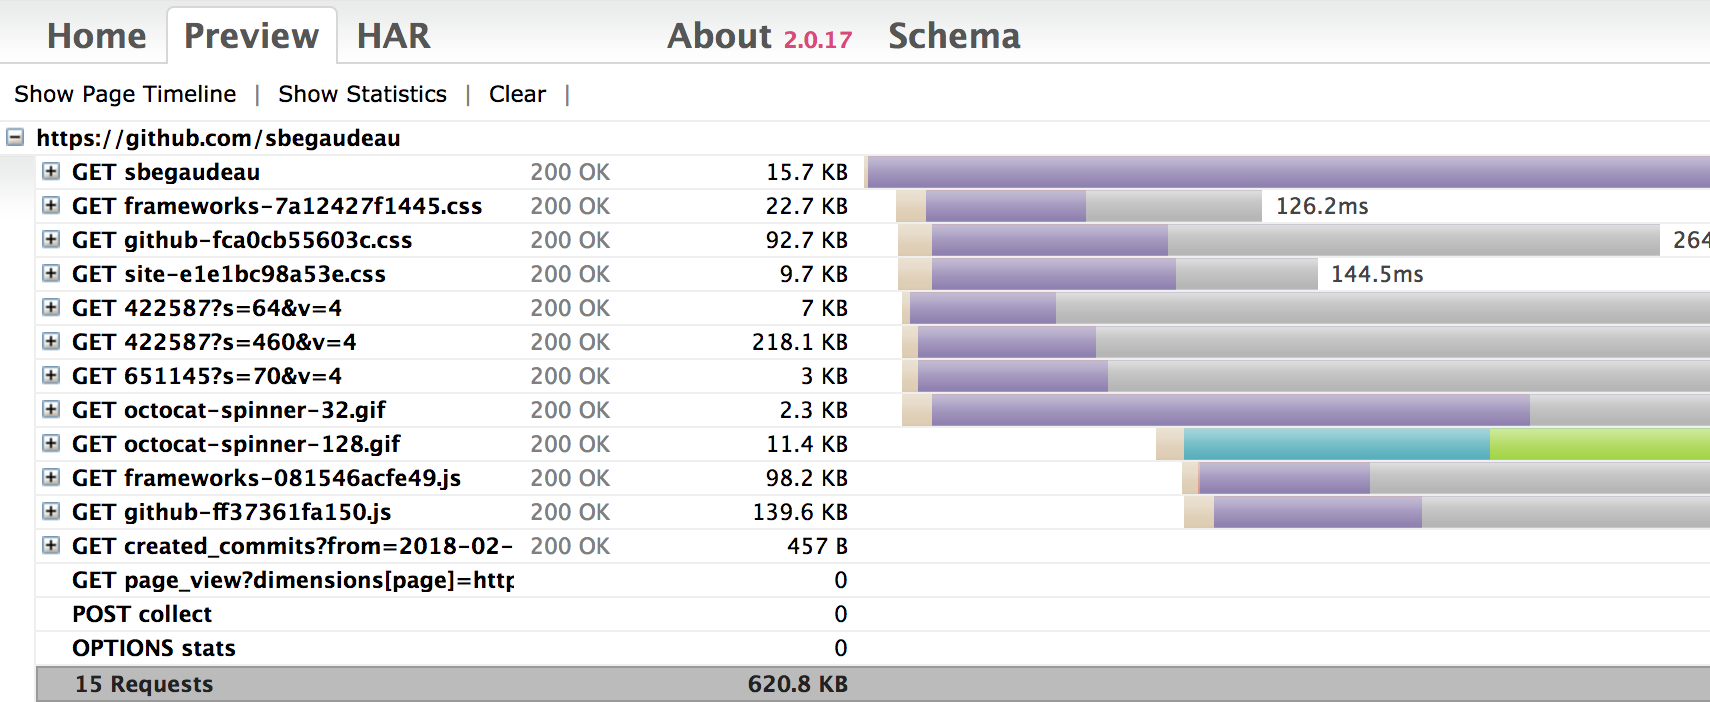
If you have found a bug in your application, it would be nice to be able to communicate the steps to reproduce the issue to other members of your team. For situations like that, you can export the content of the Network tab by right-clicking and selecting “save as HAR”. Attach this har file to an issue of your project and everybody will be able to see all the requests made to reproduce your issue. HAR viewers are also available and you can find the specification of this JSON-based format online.
Finally, with the contextual menu, you can block a specific request or even a whole domain and you also have the ability to copy various details of a request.
Advanced Options

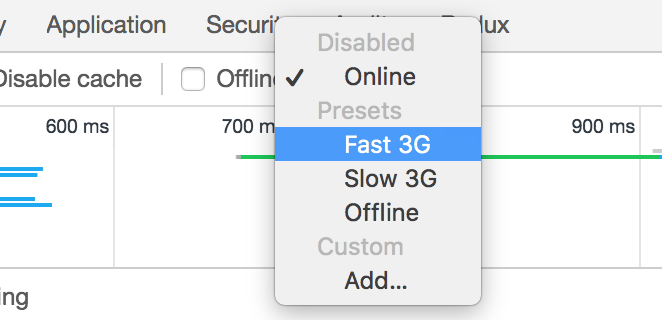
Some advanced options are available thanks to the toolbar on top of the Network overview. With a single click, you can test your web application with the cache disabled or even offline to see if your service workers are doing their job. It is also possible to simulate various quality of internet connectivity with fast 3G, slow 3G, and even custom settings.
The toolbar also offers you the ability to capture screenshots of each step of the loading of your web application thanks to the camera button. This feature gives you the ability to see how long your users have to wait to see something meaningful on your website.

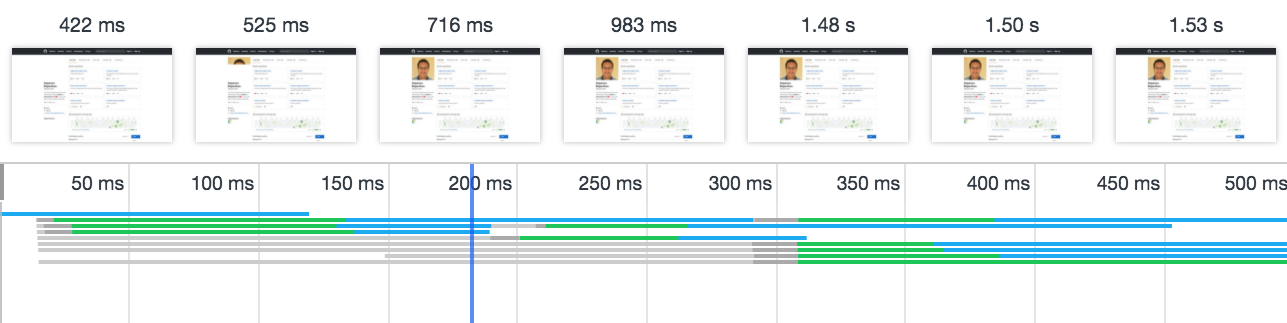
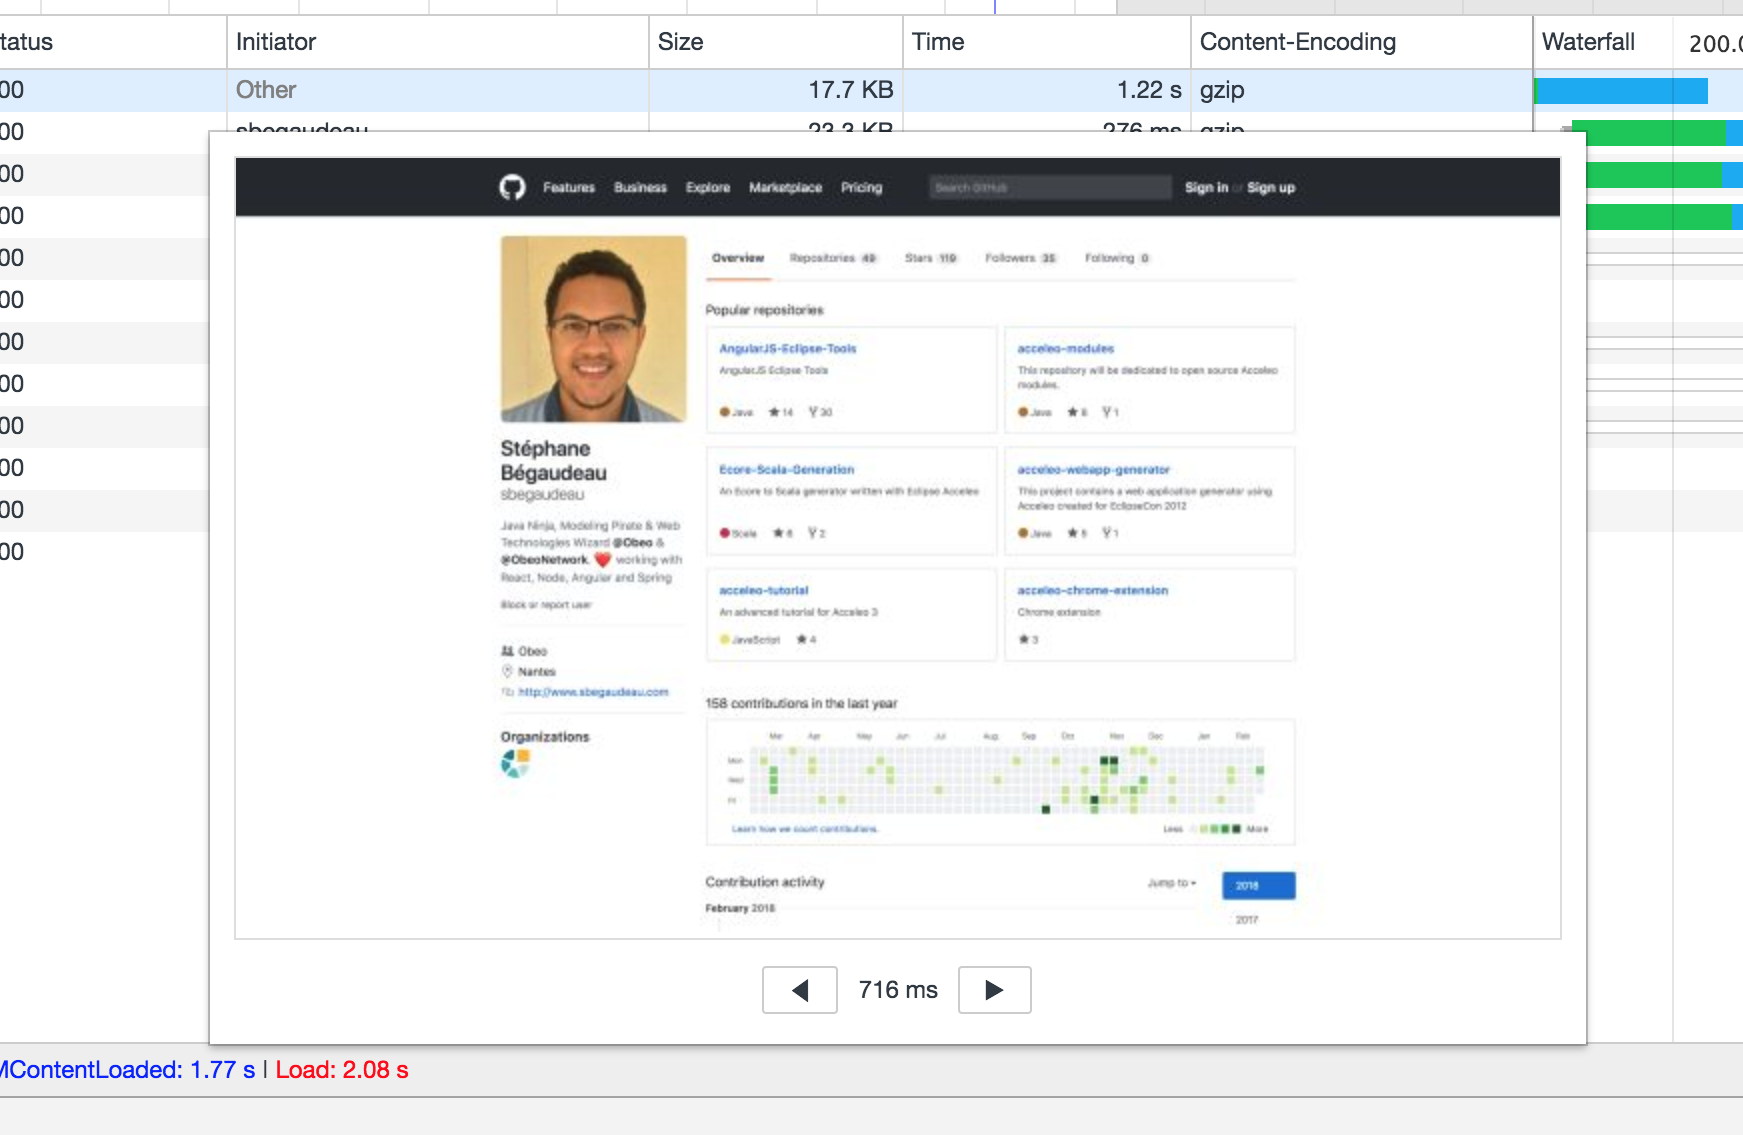
By double-clicking on a screenshot, you can see it in a larger version
For more information regarding web development or to be sure not to miss an update, follow me on twitter.